
Commonwealth Scientific And Industrial
Research Organisation (Australia)
CSIRO In Bed With Multinationals
WikipediaCSIRO-Oceans&Atmosphere
2016 Climate Science Cuts Controversy
Fluoride gasses are protected pollutants.
Carbon dioxide is not a pollutant and is essential for life.
Full complete text  HERE
HERE 
See our comments below
 1) CSIRO Oceans And Atmosphere
Citation
Dunse, B. L., N. Derek, P. J. Fraser, P. B. Krummel and L. P. Steele, Australian and global HFC, PFC, sulfur hexafluoride nitrogen trifluoride and sulfuryl fluoride emissions, Report prepared for Australian Government Department of the Environment and Energy, CSIRO Oceans and Atmosphere, Aspendale, Australia, iv, 33 pp., 2019.
…
Copyright And Disclaimer
© 2019 CSIRO To the extent permitted by law, all rights are reserved and no part of this publication covered by copyright may be reproduced or copied in any form or by any means except with the written permission of CSIRO.
Not Applicable
This information was paid for by the public,
and therefore belongs to all Australians.
.
Important Disclaimer:
CSIRO advises that the information contained in this publication comprises general statements based on scientific research. The reader is advised and needs to be aware that such information may be incomplete or unable to be used in any specific situation. No reliance or actions must therefore be made on that information without seeking prior expert professional, scientific and technical advice. To the extent permitted by law, CSIRO (including its employees and consultants) excludes all liability to any person for any consequences, including but not limited to all losses, damages, costs, expenses and any other compensation, arising directly or indirectly from using this publication (in part or in whole) and any information or material contained in it.
.
– After reading this document we all know why.
Please Note: – all the ‘Fs’ are for fluorides:
PFASs, PFCs, PFOS, PFOA, PFHxS, and PFAS
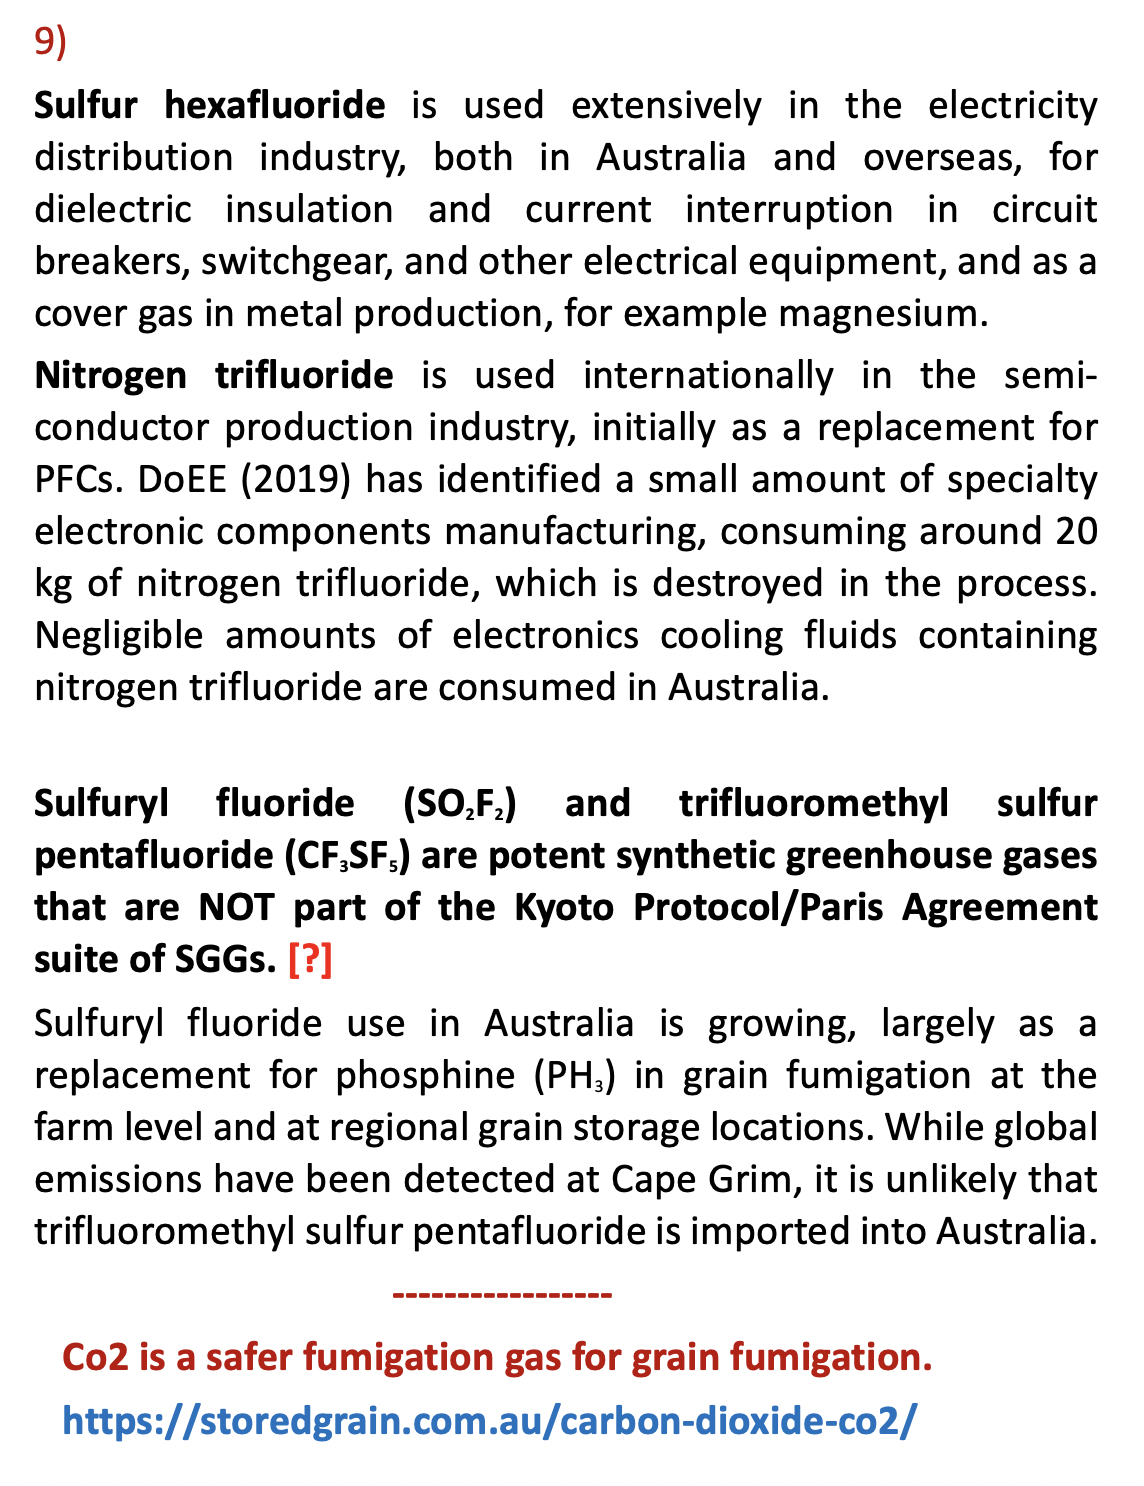
Sulfur hexafluoride [ …It is the most potent greenhouse gas currently known, with a global warming potential of 23,900 times that of CO2 over a 100 year period. SF6 has an estimated lifetime in the atmosphere of between 800 and 3,000 years…] It is used extensively in the electricity distribution industry, both in Australia and overseas, for dielectric insulation and current interruption in circuit breakers, switchgear, and other electrical equipment, and as a cover gas in metal production, for example magnesium.
Nitrogen trifluoride is used internationally in the semi-conductor production industry, initially as a replacement for PFCs. DoEE (2019) has identified a small amount of specialty electronic components manufacturing, consuming around 20 kg of nitrogen trifluoride, which is destroyed in the process. Negligible amounts of electronics cooling fluids containing nitrogen trifluoride are consumed in Australia.
Sulfuryl fluoride (SO2F2) and trifluoromethyl sulfur pentafluoride (CF3SF5) are potent synthetic greenhouse gases that are NOT part of the Kyoto Protocol/Paris Agreement suite of SGGs. [?]
Sulfuryl fluoride use in Australia is growing, largely as a replacement for phosphine (PH3) in grain fumigation at the farm level and at regional grain storage locations. While global emissions have been detected at Cape Grim, it is unlikely that trifluoromethyl sulfur pentafluoride is imported into Australia
Australia’s mandated HFC production and import phase down began on 1 January 2018 and will reach an 85% reduction in 2036. In early 2010, the Australian Government made a commitment, in light of the Kyoto Protocol/Doha Amendment, to reduce its total GHG emissions by 5 per cent below 2000 levels by 2020. GHG emission reduction targets for implementation post-2020 have been announced by the Australian government: 26%-28% reduction from 2005 emissions by 2030. This includes the commitment to phase down Australian HFC imports by 85% by 2036. There are no global or Australian targets to phase-down sulfuryl fluoride or trifluoromethyl sulfur pentafluoride emissions, as these gases are not controlled in the Kyoto Protocol, or the subsequent Paris Agreement, due to their relatively low emissions.
The Australian National Inventory reported a total of 554.1 million tonnes (Mt) CO2-e emitted from all GHG sources in 2017 (not including land-use change), which was an increase from 2016 emissions (546.6 Mt) of 1.3% (DoEE, 2019). HFC emissions were estimated to be 12.3 Mt (12,253 k tonnes) CO2-e in 2017, 2.3% above 2016 emissions, while the sum of HFC, PFC and sulfur hexafluoride emissions was 12.6 Mt (12,632 k tonnes, Table 3) CO2-e, 1.9% above 2016 emissions. Although the total emission of Kyoto Protocol SGGs is only 2.3% of total Australian greenhouse gas emissions (DoEE, 2019), it is the fastest growing emissions sector (on a percentage basis) in the Australian National GHG Inventory (referred to subsequently as the Inventory).
In this Report, we estimate Australian emissions of HFCs, PFCs, sulfur hexafluoride and sulfuryl fluoride derived by inter-species correlation (ISC), inverse and forward atmospheric modelling techniques, using Cape Grim atmospheric observations. These so-called ‘top-down’ estimates are compared to estimates of HFCs, PFCs and sulfur hexafluoride emissions submitted by the Australian Government to the UNFCCC (DoEE, 2019), based on Intergovernmental Panel on Climate Change (IPCC)-recommended ‘bottom-up’ methodologies (modified for Australian conditions where better data is available) for estimating national GHG. Australian HFC, PFC and sulfur hexafluoride emissions are compared to global emissions estimated from AGAGE (Advanced Global Atmospheric Gases Experiment; Prinn et al., 2000, 2018; Rigby et al., 2014 and updates) atmospheric observations.
11) Cape Grim in situ measurements of nitrogen trifluoride commenced in February 2015 and trifluoromethyl sulfur pentafluoride in late-2010. Preliminary inspections of the data suggest that there are no significant Australian emissions of these species.
HFCs, PFCs, sulfur hexafluoride, nitrogen trifluoride, sulfuryl fluoride and trifluoromethyl sulfur pentafluoride measured at Cape Grim, Tasmania
Concentrations of HFCs, PFCs, sulfur hexafluoride, nitrogen trifluoride, sulfuryl fluoride and trifluoromethyl sulfur pentafluoride have been measured in situ in the Southern Hemisphere atmosphere at Cape Grim, Tasmania, as part of the AGAGE program (Prinn et al., 2000, 2018) and/or in the Cape Grim Air Archive (1978-2018) at CSIRO (Aspendale), at the Scripps Institution for Oceanography (SIO, USA), and on a sub-set of the Cape Grim Air Archive at the University of East Anglia (UEA, UK) (Fraser et al., 2016). Other flask air samples from Cape Grim have been analysed at CSIRO, at SIO, at UEA and at the University of Heidelberg (Germany). The SGGs have been measured by CSIRO in situ in the atmosphere (baseline and non-baseline) at Cape Grim, Tasmania, since the late-1990s (HFCs, PFC-116: CF3CF3) and the mid-2000s (other PFCs, sulfur hexafluoride, sulfuryl fluoride). Nitrogen trifluoride (up to 2013) and trifluromethyl sulfur pentafluoride (up to 2008) have been measured on the Cape Grim Air Archive. In situ measurements of nitrogen trifluoride and trifluoromethyl sulfur pentafluoride have recently become available (February 2015 for nitrogen trifluoride and recently calibrated trifluoromethyl sulfur pentafluoride going back to late 2010). These data are used, in conjunction with similar data collected from other Northern and Southern Hemispheric sites, to
11) estimate global and regional concentration trends, atmospheric lifetimes, emissions and radiative forcings for these species:
HFCs Oram et al., 1996, 1998; Oram, 1999; O’Doherty et al., 2004, 2009, 2014; Greally et al., 2007; Stohl et al.,2009; Miller et al., 2010; Vollmer et al., 2011; Arnold et al., 2014; Fraser et al., 2014a, 2016; Krummel et al., 2014; Rigby et al., 2014; Fortems-Cheney et al., 2015; Lunt et al., 2015; Simmonds et al., 2015, 2016, 2017, 2018; Meinshausen et al., 2017; Leedham Elvidge et al., 2018; Liang et al., 2017; Montzka and Velders, 2018; Li et al., 2019
PFCs Oram, 1999; Fraser et al., 2007, 2011, 2013, 2016; Mühle et al., 2010; Ivy, 2012; Ivy et al., 2012; Laube et al., 2012; Oram et al., 2012; Kim et al., 2014; Krummel et al., 2014; Rigby et al., 2014; Wong et al., 2015; Trudinger et al., 2016; Meinshausen et al., 2017; Leedham Elvidge et al., 2018; Droste et al., 2018; Engel and Rigby, 2018; Li et al., 2019
SF6 Maiss et al., 1996; Oram, 1999; Fraser et al., 2004, 2014a, 2016; Levin et al., 2010; Rigby et al., 2010, 2014; Sturges et al. 2012; Ganesan et al., 2014; Krummel et al., 2014; Meinshausen et al., 2017; Leedham Elvidge et al., 2018; Engel and Rigby, 2018
NF3 Weiss et al., 2008; Arnold et al., 2013; Rigby et al., 2014; Meinshausen et al., 2017
SO2F2 Muhle et al., 2009; Krummel et al., 2014; Meinshausen et al., 2017
CF3SF5 Sturges et al., 2012
The abundances and trends of HFCs, PFCs, sulfur hexafluoride, nitrogen trifluoride, sulfuryl fluoride and trifluoromethyl sulfur
12) pentafluoride in the global background atmosphere, as measured at Cape Grim, Tasmania, or in the Cape Grim air archive, are shown in Table 1 (2017-2018) and Figure 1 (1998-2017).
The major HFC in the background atmosphere at Cape Grim (and around the globe) is HFC-134a (95.6 ppt in 2018), followed by HFC-23 (30.4 ppt), HFC-125 (24.6 ppt), HFC-143a (21.6 ppt), HFC-32 (15.2 ppt) and HFC-152a (4.7 ppt). The global annual rate of increase of HFC-134a has increased from 6.0 ppt (2016-2017) to 6.2 ppt (2017-2018); the HFC-23 growth rate (0.86 ppt, 2016-2017) has increased to 1.21 ppt (2017-2018); the HFC-143a annual increase (1.7 ppt, 2016-2017) has remained steady at 1.7 ppt (2017-2018); the HFC-125 annual increase (2.6, 2016-2017) has increased to 3.0 ppt/yr (2017-2018). HFC-152a concentrations had stopped growing in the background atmosphere however, for the last three years the concentrations have been increasing again, with an annual increase of 0.174 ppt/yr (2017-2018); the HFC-32 increase (2.1 ppt, 2016-2017) has increased to 2.7 ppt (2017-2018).
The annual growth in total HFCs has increased from 13 ppt/yr (2016-2017) to 15 ppt/yr (2017-2018). Total HFCs in the atmosphere are growing currently (2017-2018) at 8%/yr.
The cumulative concentration of the minor HFCs (HFC-245fa, HFC-227ea, HFC-236fa, HFC-365mfc, HFC-4310mee) is 5.3 ppt (2018), 2.7% of the total HFC concentration in the background atmosphere (197 ppt, 2018). The minor HFCs (HFC-245fa, HFC-227ea, HFC-236fa, HFC-365mfc, HFC-4310mee) are growing in the background atmosphere with a cumulative annual growth rate of 0.39 ppt (2017-2018).
Table 1. Concentrations (2017, 2018) and growth rates (2017-2018) for HFCs, PFCs, sulfur hexafluoride, nitrogen trifluoride, sulfuryl fluoride and trifluoromethyl sulfur
13) pentafluoride measured in situ at Cape Grim, Tasmania or on air samples collected at Cape Grim (references: see text above; CSIRO unpublished Cape Grim Air Archive data).
Global HFC data have shown that the total level of HFCs in the background atmosphere is consistent with total emissions from ‘bottom-up’ inventories, but there are significant differences between atmospheric data and emissions inventories for
14) individual HFCs. For HFC-134a, global emissions from atmospheric observations are seasonal (NH summer maximum, Fortems-Cheiney et al., 2015) and 20%-30% lower than inventory estimates of emissions (2007-2012, Fortems-Cheiney et al., 2015, Lunt et al., 2015), whereas HFC-31, HFC-125, HFC-143a global emissions are 20%-30% higher than inventory estimates (Lunt et al., 2015). Over-reporting of HFC-134a, HFC-32 and HFC-125 emissions (10%-100%, 2004-2014, Simmonds et al., 2015; Hu et al., 2017) and under-reporting of HFC-143a emissions (40%-60%, 2007-2012, Simmonds et al., 2015) have occurred in the USA inventory compared to emissions based on atmospheric observations. The global growth rate of HFC-23 emissions slowed significantly, reaching a minimum in 2009, when resources under the Kyoto Protocol (the Clean Development Mechanism – CDM) were used to improve HCFC-22 (CHClF2) production methods and capture the co-produced but waste HFC-23. The cessation of CDM funding has resulted in global HFC-23 emissions growing again (Simmonds et al., 2018).
Regional inverse studies have shown that the growing levels of HFCs in the background global atmosphere result from growing emissions from China/East Asia (Fortems-Cheiney et al., 2015), offset by declining HFC emissions from developed countries (USA, Europe).
HFC replacement chemicals (HFC-1234yf – CF3CFCH2, HFC-1234ze – CF3CHCHF) have been detected in urban and background atmospheres in Europe (Switzerland: Dubendorf and Jungfraujoch, Vollmer et al., 2015) since 2013-2014 at the sub-ppt level and have recently been measured in Cape Grim air.
Total fluorine from HFCs reached 732 ppt in 2018 growing at 8%/yr (2017-2018). The major PFC in the background atmosphere at Cape Grim (and around the globe) is PFC-14 (CF4: 84.0 ppt in 2018, about 40% of which is naturally-occurring), followed by
15) PFC-116 (4.7 ppt), PFC-318 (1.6 ppt), PFC-218 (0.65 ppt), PFC-5114 (0.31 ppt) and PFC-3110 (0.19 ppt). The cumulative concentration of three minor PFCs (PFC-4112, PFC-6116, PFC-7118) observed at Cape Grim is 0.33 ppt (2018, extrapolated from 2011 data). The total PFC concentration in the background atmosphere is 91.8 ppt (2018), currently growing at 1.1 ppt/yr (1.2%/yr). The total anthropogenic PFC concentration in the background atmosphere is 57.7 ppt growing at 2%/yr.
The annual rate of increase of PFC-14 in the atmosphere increased from 0.84 ppt (2016-2017) to 0.95 ppt (2017-2018), 0.2 ppt higher than the decadal average annual increase of 0.75 ppt (2009-2018). The anthropogenic component (from aluminium production and the electronics industries) of atmospheric PFC-14 is growing at 1.9%/yr. The annual rate of increase of PFC-116 (CF3CF3) is 0.094 ppt (2017-2018), slightly higher than the decadal average annual increase (0.08 ppt, 2009-2018); the PFC-218 annual increase (0.018 ppt, 2017-2018) is higher than the decadal annual average (0.016 ppt, 2009-2018); the PFC-318 annual increase (0.066 ppt, 2017-2018) is higher than the 9-year average annual increase (0.05 ppt, 2010-2018). The minor PFCs (PFC-3110, PFC-4112, PFC-5114, PFC-6116, PFC-7118) are growing in the background atmosphere with a cumulative annual growth rate likely to be of the order 0.01-0.02 ppt (2013-2018).
Total fluorine from PFCs reached 394 ppt in 2018, growing at 1.3%/yr (2017-2018).
The measured amount of PFC-14 in the global atmosphere is significantly higher than that calculated due to the accumulated emissions from the aluminium and semiconductor industries (Muhle et al., 2010). There appears to have been significant under-reporting of emissions by the semiconductor industry over the past decades and a recent under-reporting of emissions by the aluminium industry, possibly associated with the rapid
16) growth in aluminium production in China (Kim et al., 2014). Under-reporting of PFC emissions from the aluminium industry may be due to the assumption that PFC emissions only occur during so-called ‘anode effect events’, whereas there may be quasi-continuous PFC emissions throughout the aluminium production process (Wong et al., 2015). PFC-14 emissions have been shown to respond to economic/industrial activity, with enhanced emissions during WWII due to the demand for aluminium for aircraft, and reduced emissions during the recent GFC (Trudinger et al., 2016).
Annual mean sulfur hexafluoride levels reached 9.4 ppt in 2018 at Cape Grim, growing at 0.36 ppt/yr (3.9%/yr, 2017-2018), similar to the 2016-2017 annual average growth rate. The decadal annual average growth rate is much lower at 0.32 ppt/yr (2009-2018). Annual mean sulfuryl fluoride levels reached 2.3 ppt in 2018 at Cape Grim, growing at 0.11 ppt/yr (4.9%/yr), close to the 10-yr average growth rate (0.09 ppt/yr, 2009-2018). Trifluoromethyl sulfur pentafluoride stopped growing in the Cape Grim atmosphere in 2007 (0.16 ppt), as seen in UEA Cape Grim Air Archive measurements (Sturges et al., 2012), following 3M’s decision to cease PFOS production (Santaro, 2000). In situ measurements at Cape Grim have recently been calibrated (SIO-14 scale) and show annual mean concentrations of 0.17 ppt in 2017 and in 2018. The current measurement precision is (±0.004 ppt, 1 standard deviation). If there is no further production/release of trifluoromethyl sulfur pentafluoride, its concentration in the atmosphere should remain effectively constant due to its very long atmospheric lifetime (800 yr). With zero emissions, atmospheric concentrations should decline by only 0.05% (<0.001 ppt)/yr. Given the uncertainty in the measurements, a longer record is required to define a possible trend in this species.
17) Nitrogen trifluoride is growing rapidly in the background atmosphere. In February 2015, in situ measurements of nitrogen trifluoride began at Cape Grim. The mean concentration of nitrogen trifluoride is 1.5 ppt for 2017 and 1.7 ppt for 2018, growing at 0.18 ppt/yr (11%/yr). Following the recent inclusion of nitrogen trifluoride into the post-Kyoto Protocol ‘basket’ of GHGs (Paris Agreement), it is anticipated that the current rapid growth rate will decline as alternatives are introduced into the semiconductor manufacturing industry.
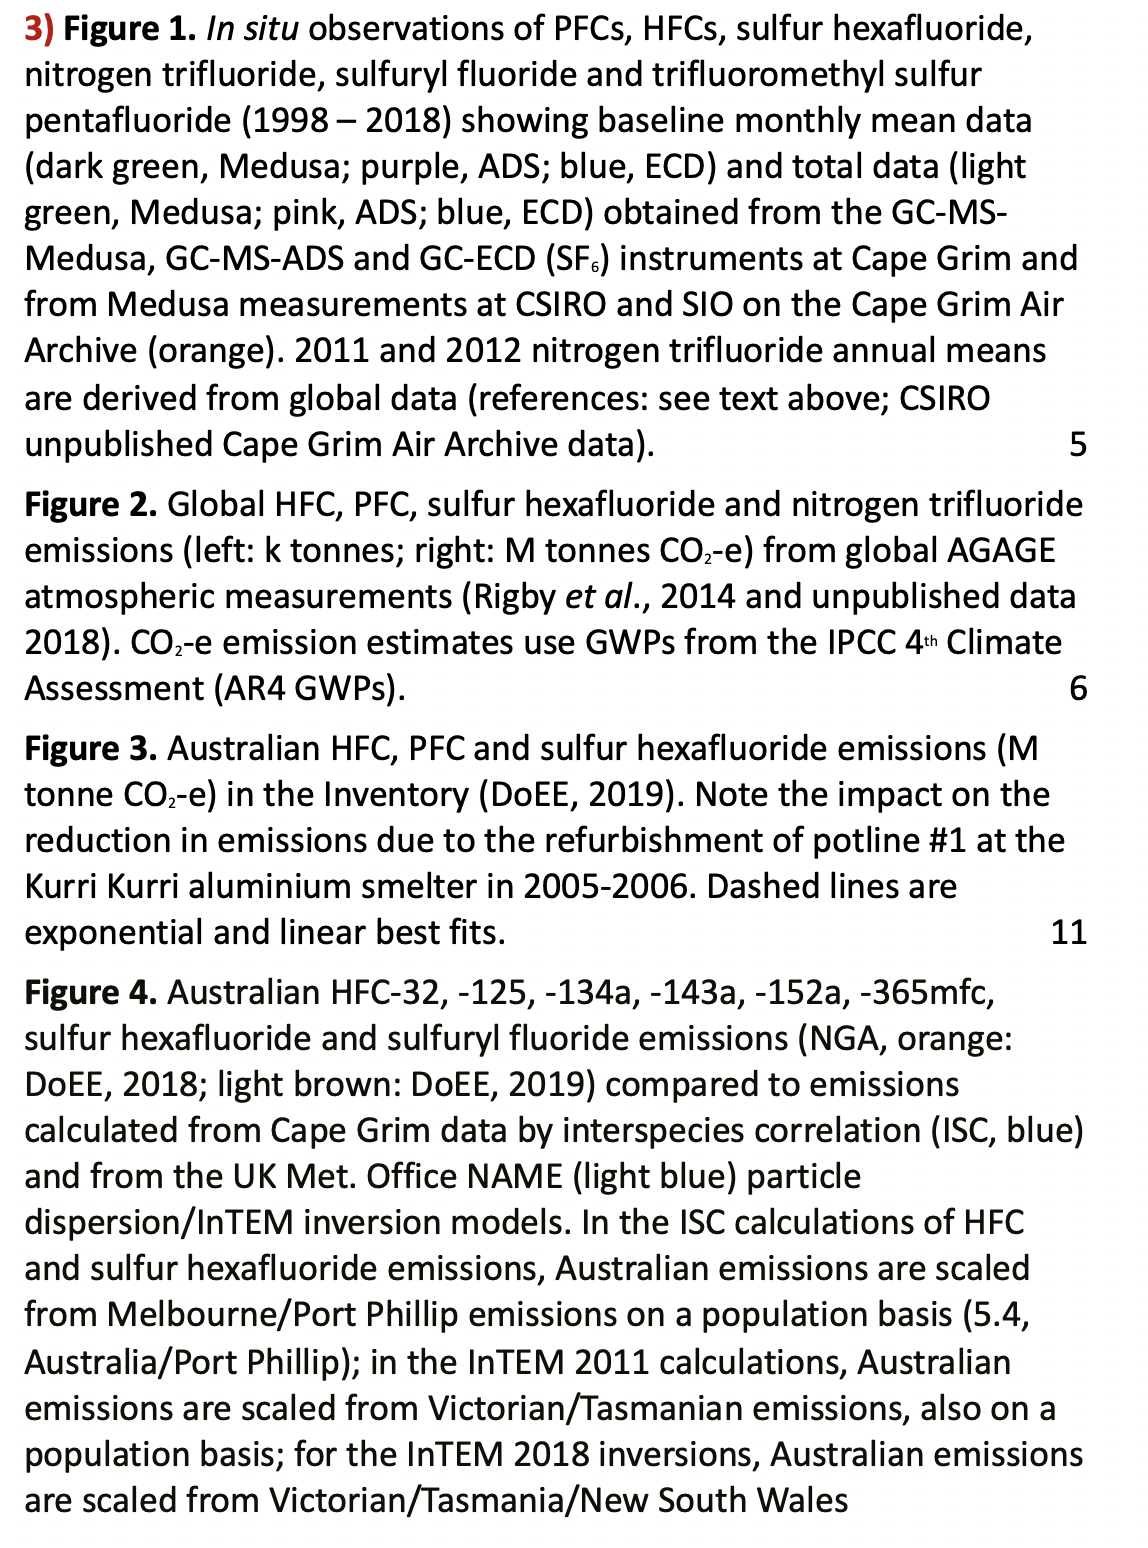
19) Figure 1. In situ observations of PFCs, HFCs, sulfur hexafluoride, nitrogen trifluoride, sulfuryl fluoride and trifluoromethyl sulfur pentafluoride (1998 – 2018) showing baseline monthly mean data (dark green, Medusa; purple, ADS; blue, ECD) and total data (light green, Medusa; pink, ADS; blue, ECD) obtained from the GC-MS-Medusa, GC-MS-ADS and GC-ECD (SF6) instruments at Cape Grim and from Medusa measurements at CSIRO and SIO on the Cape Grim Air Archive (orange). 2011 and 2012 nitrogen trifluoride annual means are derived from global data (references: see text above; CSIRO unpublished Cape Grim Air Archive data).
Global HFC, PFC, sulfur hexafluoride, nitrogen trifluoride and sulfuryl fluoride emissions
Global emissions of HFCs, PFCs, sulfur hexafluoride, nitrogen trifluoride and sulfuryl fluoride have been estimated from AGAGE global data (including Cape Grim data) by inverse modelling up to 2017 (Figure 2; Rigby et al., 2014 and Rigby, unpublished data).
Figure 2. Global HFC, PFC, sulfur hexafluoride and nitrogen trifluoride emissions (left: k tonnes; right: M tonnes CO2-e) from global AGAGE atmospheric measurements (Rigby et al., 2014 and unpublished data 2018). CO2-e emission estimates use GWPs from the IPCC 4th Climate Assessment (AR4 GWPs).Total global HFC emissions were 493 k tonnes in 2017, rising by nearly 18 k tonnes/yr since 1995; total global HFC emissions in 2017 were 9%
20) higher than in 2016. Global emissions of the major HFCs (HFC-32, HFC-125, HFC-134a, HFC-143a) increased from 2016 to 2017: 25%, 15%, 3%, 10% respectively; global emissions of HFC-152a peaked in 2011 and were in decline, but have increased again to 55 ktonnes/yr in 2017. HFC-23 global emissions increased by 15% from 2016 to 2017. HFC-134a emissions exhibit significant seasonality, in particular at the mid-latitudes of the northern hemisphere, with summer emissions 2-3 times winter emissions (Xiang et al., 2014; Fortems-Cheiney et al., 2015; Simmonds et al., 2015).
Total PFC emissions have declined from 24 k tonnes/yr in the late-1970s to 19 k tonnes/yr in 2017. Emissions from 1993 until 2014 were around 15 k tonnes/yr. Global emissions of the major PFCs (PFC-14, PFC-116) increased from 2016 to 2017 by 17% and 16% respectively.
Sulfur hexafluoride emissions have been increasing steadily from about 3 k tonnes per year in the late-1970s to approaching 9 k tonnes per year in 2017 (an increase of around 0.15 k tonnes/yr). Sulfur hexafluoride emissions increased by 2% from 2016 to 2017.
Nitrogen trifluoride emissions were first observed in the mid-1990s, growing at 0.08 k tonnes/yr since 1995 to 2.3 k tonnes in 2017. The 2016-2017 increase was 15%.
Total global HFC, PFC, sulfur hexafluoride and nitrogen trifluoride emissions have risen (10 k tonnes/yr, largely HFCs) from about 30 k tonnes per year in the late-1970s to around 523 k tonnes per year in 2017, with a 2016-2017 increase of 9%.
Global sulfuryl fluoride emissions (not shown in Figure 2) were around 1 k tonnes per year in the late-1970s, peaking at 3.6 k tonnes per year in 2015 and 2016, then declining to 3.0 k tonnes per year in 2017. There is significant year to year variability in
21) emissions, presumably due to the global demand for sulfuryl fluoride being dependant on, in part, variable global grain production. [Co2 is a safer option]
Australian HFC, PFC and sulfur hexafluoride imports, banks and emissions HFCs and sulfur hexafluoride are not manufactured in Australia and estimates of Australian HFC and sulfur hexafluoride emissions, reported annually to the UNFCCC (see below), are based on import data (Table 2). HFCs and sulfur hexafluoride are imported as bulk chemicals or in pre-charged equipment (PCE), leading to estimates of ‘banks’ of HFCs and sulfur hexafluoride stored in equipment or products such as refrigerators, air conditioners, fire extinguishers, foams, aerosols and electrical equipment. Only small amounts of PFCs are imported into Australia (Table 2) and these are not considered to be a significant source of PFC emissions; Australian PFC emissions are assumed to originate exclusively from aluminium production (see below).
HFC imports in 2018 were 7498 metric tonnes, 51% in bulk, 49% in pre-charged equipment (PCE), 20% lower than HFC imports in 2017. This reduction is in line with Australia’s mandated HFC production and import phase down which began on 1 January 2018. HFC imports had previously grown by 10% per year over the period 2008-2017. PFC imports in 2017 and 2018 were about 0.17 and 0.47 tonnes respectively.
Sulfur hexafluoride imports in 2018 were 12 tonnes, 37% lower than 2017 imports. Sulfur hexafluoride imports vary significantly year-to-year. Thirty four (34) tonnes of sulfur hexafluoride were exported in 2016, presumably from a stockpile of sulfur hexafluoride previously imported, but none exported in 2017 or
22) 2018. Since 2012, sulfur hexafluoride imports have totalled 132 tonnes and exports 37 tonnes, leaving 95 tonnes in Australia.
Table 2. Australian HFC, PFC, sulfur hexafluoride imports (tonnes; calendar years 2017, 2018, A. Gabriel, Department of Environment and Energy, 2019); PCE = pre-charged equipment.
The National Greenhouse Gas Inventory (NGGI: ageis.climatechange.gov.au) published in 2019 contains estimates of Australian emissions of HFC-23, HFC-32, HFC-125, HFC-134 (CHF2CHF2, not measured currently at Cape Grim), HFC-134a, HFC-143a, HFC-152a, HFC-227ea, HFC-236fa, HFC-4310mee, PFC-14, PFC-116 and sulfur hexafluoride, up to 2017, which form part of the National Inventory Report 2017 (DoEE, 2019). The Inventory is the Australian government submission to the UNFCCC and which forms a part of the Australian National Greenhouse Accounts (NGA). Note the annual emissions in the NGGI and in the National Inventory Report are for fiscal years, i.e. ‘2013’ emissions are emissions for July 2012 to June 2013.
The HFC emissions (Table 3) are based on HFC import data (Table 2), as bulk HFCs or PCE, leading to an estimate of ‘banks’ of HFCs stored in equipment or products (refrigerators, air conditioners, fire extinguishers, foams, aerosols – largely metered-dose inhalers) [Co2 is a safer option] and appropriate application-dependent emission factors from those ‘banks’, which allow for emissions during the lifetime of the application, as well as emissions from initial charging/re-charging of equipment and equipment disposal.
In the National Inventory Report 2017 (DoEE, 2019), two significant changes have been implemented for determining Australian estimated HFC emissions. The first change is that the annual leak rates are calibrated to the CSIRO HFC emissions
24) estimates for all equipment types from 2006 onwards. The second change to the method is CSIRO species data is used to modify the species percentages each year from 2006 onwards.
Australian HFC emissions were about 110 tonnes in 1995, rising to 5556 tonnes (12253 CO2-e ktonnes) in 2017. HFC-134a emissions increased by about 65 tonnes (2%) from 2016 to 2017, all other HFCs by about 57 tonnes (2%). Emissions of total HFCs (in CO2-e terms) in 2017 were 2% higher than in 2016.
In the Australian GHG emission inventory, PFC (PFC-14, PFC-116) emissions only arise from aluminium production, with total PFC emissions in 2017 of 24 tonnes (0.20 Mt CO2-e, DoEE, 2019). About 0.17-0.47 tonnes of PFCs (PFC-14, PFC-116) were imported into Australia in 2017-2018 as refrigerant blends in bulk and PCE (Table 2). It is not clear whether these PFC imports are used to calculate corresponding contributions to PFC emissions – if they are, they are very small compared to PFC emissions from the aluminium industry (24 tonnes in 2017, Table 3). PFC emissions in the Inventory fell from 37 tonnes in 2012 to 24 tonnes in 2013 due to the closure of the Kurri Kurri smelter in NSW and from 24 tonnes in 2014 to 22 tonnes in 2015 due to the closure of the Point Henry smelter in Victoria. PFC emissions in the Inventory in 2017 are about 17% lower compared to 2016. This decline is due to aluminium production decreasing by 8% and the PFC-14 emission factor from DoEE, (2019) has also decreased (20%).
Australian sulfur hexafluoride emissions are largely (90%) from the electricity supply and distribution network, with 10% from electrical supply equipment manufacture. Emissions (1975-2017) are estimated as leakages from sulfur hexafluoride ‘banks’ in the electricity supply and distribution network and leakages from Australian manufacture of electricity supply equipment, using a combination of default IPCC and Australian-specific emissions factors (DoEE, 2019).
25) Australian emission factors for electrical equipment stock are global IPCC default factors: 0.05 tonne (t) emitted per year per tonne (t) of stock (1975-1995), 0.02 t/t (2000); an Australian-specific base emission factor (0.0089 t/t) has been estimated for 2009 (DoEE, 2019) and then scaled in subsequent years by the estimates of Australian sulfur hexafluoride emissions from Cape Grim atmospheric observations (DoEE, 2019). For 1995-2000-2009 periods, emission factors are linearly interpolated. The 2009 emission factor (0.0089 t/t) is based on emission estimates from 15 utilities (the major consumers of sulfur hexafluoride in Australia) using their own data on sulfur hexafluoride consumption (consumption = emissions, not defaulting to the IPCC method). The 2016 and 2017 emission factors (after scaling by Cape Grim data) are 0.0093 tonne sulfur hexafluoride per tonne sulfur hexafluoride banked i.e. 0.93% (DoEE, 2019).
The sulfur hexafluoride emission factors assumed for Australian equipment manufacture (0.15 t/t, 1975-1995; 0.085 t/t, 1996-2017) are IPCC default factors for Europe. The original global IPCC default factor for manufacturing (0.74 t/t) was significantly higher and currently IPCC recommends 0.30-0.35 t/t (prior to 1995) and 0.12 t/t after 1995, both significantly higher than the assumed Australian emission factor for equipment manufacture. These IPCC factors are for gas insulated switchgear (GIS); higher factors are recommended for circuit breakers (0.55 t/t prior to 1995, 0.29 t/t after 1995). Circuit breakers are used extensively in the USA, GIS in Europe. The Australian inventory assumed GIS values, presumably because Australia uses largely GIS equipment in its electricity distribution networks. Since the equipment manufacture sector emits only 10% of Australia’s sulfur hexafluoride, total sulfur hexafluoride emissions are relatively insensitive to the choice of emission factors for this
26) sector. Australian sulfur hexafluoride emissions in the Inventory are 7.7 tonnes for 2017. Of the approximate 80 tonnes of sulfur hexafluoride imported into Australia since 2012, about 40 tonnes have been emitted to the atmosphere and 40 tonnes have gone into the electrical equipment bank (DoEE, 2018).
Australian sulfur hexafluoride emissions from tracer gas studies, eye surgery etc. have been estimated at 1 kg of sulfur hexafluoride as CO2-e per person per year or a total of 1.1 tonnes of sulfur hexafluoride per year (DoEE, 2018). Thus, total Australian emissions of sulfur hexafluoride in 2017 (electrical equipment and other uses) was 7.7 tonnes.
The quantity of sulfuryl fluoride imported each year into Australia depends, in part, on the annual grain harvest. Before 2007, Australian sulfuryl fluoride imports were significantly less than 50 tonnes per year, reaching current levels of imports (∼150 tonnes per year) by 2011-12, continuing at about this level until 2015-16, with 2016-17 imports higher due to a record grain harvest (M. Stein, A-Gas, pers. comm.). Mühle et al. (2009) estimate that approximately 2/3 of sulfuryl fluoride used in fumigation escapes to the atmosphere, so current Australian sulfuryl fluoride emissions are likely to be about 100 tonnes per year (∼0.5 M tonnes CO2-e), 2-3 times larger than the CO2-e emissions due to sulfur hexafluoride (0.18 M tonnes CO2-e in 2017). Globally, the reverse is the case, with the CO2-e emissions of sulfur hexafluoride (200 M tonnes, 2017) being significantly higher than for sulfuryl fluoride (15 M tonnes, 2017).
The HFC, PFC and sulfur hexafluoride contributions to total emissions from this sector are shown in Figure 3. The significant impact on total emissions in 2005-2006 due to reduced PFC emissions (the Kurri Kurri aluminium smelter upgrade) can be clearly seen. Prior to the significant reduction in PFC emissions at Kurri Kurri in 2005, Australian HFC/PFC/sulfur hexafluoride
27) emissions grew at about 12%/yr (Figure 3). After the Kurri Kurri upgrade, these combined emissions grew at about 7%/yr. The Australian Kyoto Protocol/Paris Agreement-SGG emissions are 97% HFCs, 2% PFCs and 1% sulfur hexafluoride.
28) Table 3. Australian HFC, PFC and sulfur hexafluoride emissions (http://unfccc.int/national_reports/ annex_i_ghg_inventories/national_inventories_submissions/items/10116.php). HFC-23 emissions in 1995 from HCFC-22 production in Sydney. Not shown are small HFC-236fa emissions (0.005 tonnes in 2016). Note GWPs used are AR4.
30)
32)
Australian HFC, PFC, sulfur hexafluoride and sulfuryl fluoride emissions from atmospheric data
HFC, sulfur hexafluoride and sulfuryl fluoride emissions
CSIRO estimates emissions of a number of greenhouse and ozone depleting trace gases from the Melbourne/Port Phillip region (Dunse et al., 2001, 2005; Dunse 2002; Greally et al., 2007; Stohl et al., 2009; Fraser et al., 2014b, 2016; Simmonds et al., 2016), utilising in situ high frequency measurements from the Cape Grim Baseline Air Pollution Station in Tasmania and employing the interspecies correlation (ISC) technique with co-incident carbon monoxide (CO) measurements or inverse modelling (InTEM).
Port Phillip HFC, PFC-116 and sulfur hexafluoride emissions have been calculated, by ISC from Cape Grim data (2004-2017, Krummel et al., 2014 and unpublished data) and presented as 3-year running averages (2005-2017; Table 4, Figure 4). The HFC, PFC-116 and sulfur hexafluoride emissions are derived from Port Phillip emissions, scaled to Australian emissions on a population basis. NOAA air mass back trajectory analyses (Draxler and Hess, 1997) are used to ensure that the pollution events at Cape Grim used to derive Port Phillip emissions are imbedded in air masses that only pass over the Port Phillip region and do not include
33) other possible high carbon monoxide source regions, in particular the Latrobe Valley, or high carbon monoxide emission events (biomass burning).
The NAME particle dispersion model coupled to the InTEM inversion model (O’Doherty et al., 2009; Manning et al., 2003, 2011; Redington and Manning, 2018) is used to calculate HFC, PFC (see below), sulfur hexafluoride and sulfuryl fluoride emissions. NAME (Numerical Atmospheric Dispersion Modelling Environment) is a Lagrangian particle dispersion model driven by 3-dimensional wind fields from numerical weather predictions models. For a more detailed description of the NAME model see Appendix A.
Cape Grim sulfuryl fluoride measurements commenced in 2004, but significant pollution episodes (as selected for ISC calculations) were not observed at Cape Grim until 2010. These pollution episodes are used to calculate SE Australian (largely Victorian) sulfuryl fluoride emissions by ISC. Grain exported from Victorian grain terminals, or produced in Victoria, accounts for about 10-20% of Australia’s grain production/exports (National Transport Commission, 2008; ABARES 2018) and thus possibly 10-20% of Australia’s emissions of sulfuryl fluoride. SE Australian sulfuryl fluoride emissions calculated from Cape Grim data by ISC are scaled to Australian emissions by this factor (i.e. multiplied by 7.0±2.1) (Table 4, Figure 4). The InTEM model domain used to derive sulfuryl fluoride emissions is Victoria/Tasmania/New South Wales, and the scale factor used to derive Australian emissions, based on grain production, is 2.4±0.2. Australian emissions of sulfuryl fluoride averaged about 120 tonnes/yr (573 k tonnes CO2-e) over the period 2011-2017, some 3%-4% of global emissions (see above), similar to Australia’s fraction of global grain production (~2%). Australian sulfuryl fluoride imports are 3G
34) around 150 tonnes per year (M. Stein, A-Gas, personal communication).
35)
Table 4. Australian HFC, PFC, sulfur hexafluoride and sulfuryl fluoride emissions (tonnes, 2005-2016) from atmospheric data, collected at Cape Grim, Tasmania – emissions calculated by interspecies correlation (ISC) and from inversions using the UK Met Office NAME particle dispersion model and the InTEM inversion model (InTEM 2012, InTEM2018). For years when InTEM inversions are not available, ISC data are assumed. The emissions are 3-year running averages, i.e. ‘2010’ = average of 2009, 2010, 2011 emissions. Australian HFC and sulfur hexafluoride emissions (ISC, InTEM) are scaled from regional emissions by population; GWPs (to calculate CO2-e emissions) are from the National Inventory Report 2015 (DoEE, 2017). PFC-14 emissions are the TAPM-InTEM average from Table 5. Australian PFC-116 emissions are from InTEM (Vic/Tas) scaled by aluminium production; Australian PFC-218 and PFC-318 emissions are from InTEM and ISC scaled by population; Australian sulfuryl fluoride emissions are from ISC and InTEM estimates of SE Australian emissions scaled by grain production.
*includes HFC-32, HFC-125, HFC-134a, HFC-143a 1assumed = 2007 emissions 2assumed = 2008 emissions 3assumed = 2011 emissions 4assumed = ISC data 5assumed = 2006 emissions 6assumed = 2016 emissions
Figure 4. Australian HFC-32, -125, -134a, -143a, -152a, -365mfc, sulfur hexafluoride and sulfuryl fluoride emissions (NGA, orange: DoEE, 2018; light brown: DoEE, 2019) compared to emissions calculated from Cape Grim data by interspecies correlation (ISC, blue) and from the UK Met. Office NAME (light blue) particle dispersion/InTEM inversion models. In the ISC calculations of HFC and sulfur hexafluoride emissions, Australian emissions are scaled from Melbourne/Port Phillip emissions on a population basis (5.4, Australia/Port Phillip); in the InTEM 2011 calculations, Australian emissions are scaled from Victorian/Tasmanian emissions, also on a population basis; for the InTEM 2018 inversions, Australian emissions are scaled from Victorian/Tasmania/New South Wales emissions, also on a population basis. Also shown are Australian sulfuryl fluoride emissions from ISC and InTEM, scaled on a grain production basis. The data shown in red are emissions from the refrigerant bank and are show in red (Brodribb and McCann, 2015).
PFC-14 emissions
SE Australian emissions of PFC-14 (CF4) are evident in the PFC-14 data collected at Cape Grim (Figure 5). Inspection of Figure 5 shows an overall decline in intensity of PFC-14 pollution episodes due to declining emissions. The year-to-year variability of the number and intensity of PFC-14 episodes seen at Cape Grim is large, so 3-year averaging is used when deriving PFC emissions from these data (so the latest annual emission calculated from these data is for 2017). Detailed analysis of these PFC-14 pollution episodes shows clearly that the Cape Grim PFC-14 pollution originates largely from southern Victoria from the Point Henry and Portland smelters, with some contribution from Bell Bay, Tasmania (Note: the Point Henry smelter closed in July 2014).
The Cape Grim PFC-14 pollution episode data have been used to estimate PFC-14 emissions from these SE Australian smelters. A regional transport model (TAPM – The Air Pollution Model; Hurley, 2008; Hurley et al., 2008) is used to calculate emissions in which PFC-14 is released into the model atmosphere from the Point Henry, Portland and Bell Bay locations, with annual emissions that are varied, so that the resultant PFC pollution episodes seen at Cape Grim in the model are a best-fit match to observations. The emissions are constant in any one year, varied year-by-year. Smelter-specific emission factors are calculated from the emissions by dividing by the smelter-specific annual aluminium production (Fraser et al., 2007, 2011).
The NAME transport and InTEM inversion models are used to derive PFC emissions from the Victoria/Tasmania/NSW domain containing aluminium smelters at Portland, Point Henry, Bell Bay, Kurri Kurri and Tomago smelters.
The TAPM and InTEM estimates of regional PFC-14 emissions are scaled to derive Australian emissions on an aluminium production basis. For example, if the PFC-14 emissions derived for the SE Australian smelters, which account for about 35% of Australia’s aluminium production, are assumed to be representative of all Australian aluminium production, then Australian PFC-14 emissions from aluminium production can be derived and compared to emissions in the National Inventory Report 2017 (DoEE, 2019) (Figure 7). The emission factors and emissions calculated for the Point Henry, Portland and Bell Bay smelters are shown in Table 5. Australian PFC-14 emission factors as reported in the National Inventory Report 2017 (DoEE, 2019) and as derived from atmospheric measurements at Cape Grim using NAME/TAPM (to 2011) and TAPM (to 2017) modelling are shown in Figure 6.
The Australian emissions derived from atmospheric data prior to 2006, using TAPM or InTEM (Vic/Tas) are likely to be underestimated due to the very significant PFC-14 emissions from a single pot-line (#1) at Kurri Kurri, which accounted for nearly half of all Australian PFC emissions from aluminium smelting in 2005. The pot-line was upgraded in 2006 and this accounts for the dramatic drop in PFC-14 emissions from 2005 to 2006 in the National Inventory Report. The large PFC emissions prior to 2006 are not seen in the TAPM estimates of emissions, as they are based on Bell Bay/Pt Henry/Portland data. The NAME inversion, based on the Vic/Tas/NSW domain, uses all pollution episode data, including any Kurri Kurri- or Tomago-affected data that may have impacted on Cape Grim (the Kurri Kurri and Tomago smelters are located in the Hunter Valley, NSW). This is why the Australian PFC-14 estimates in 2005 (182 tonnes) based on the NAME (Vic/Tas/NSW) emissions are significantly greater than the TAPM estimates for 2005 (95 tonnes).
In 2017, Australian PFC-14 emissions (TAPM, 90 tonnes) were about 0.6% of global emissions (14 k tonnes). The only significant PFC-14 source in Australia is aluminium production, whereas globally both aluminium production and the semiconductor production industry are significant sources of PFC-14 emissions.
Table 5. Australian PFC-14, PFC-116, PFC-218, PFC-318 emissions (t: tonnes) and PFC-14, PFC-116 emission factors (g/t aluminium, 2005-2016) derived from atmospheric observations – remote (Portland, Pt Henry, Bell Bay) (3 yr averages, e.g. 2010 = average of 2009, 2010, 2011), using the TAPM and NAME models, directly, at Kurri Kurri.
1 Dalzell, E., Hydro Australia 2013, personal communication
2 Australian emissions scaled from Portland, Pt Henry, Bell Bay emissions by aluminium production
3 Australian emissions scaled from Portland, Pt Henry, Bell Bay, Kurri Kurri, Tomago emissions by aluminium production
4 C2F6/CF4 = 0.1, Kim et al., (2014)
5 TAPM (Portland, Pt Henry, Bell Bay average emissions)/aluminium production
6 NAME (Vic/Tas/NSW) emissions/aluminium production; NAME emissions for 2011 are based on 2010-2011 data only
7 emission factor for 2009 (Fraser et al., 2013)
8 TAPM or ISC only 2012 onwards
9 Note: Pt Henry closure in July 2014
Other PFC emissions
Figure 8 shows the Australian PFC-116 emissions from the National Inventory Report 2017, from PFC-14 emissions (TAPM/NAME) assuming a PFC-116/PFC-14 mass emission factor of 0.10±0.01, based on atmospheric observation at Aspendale on the Pt Henry/Portland PFC plumes and on direct measurements on the Kurri Kurri exhaust stack (Fraser et al., 2013; Kim et al., 2014). The overall agreement is good, as expected, as the emissions are from the aluminium industry only, with current emissions (since 2009) of about 6 tonnes/yr.
Cape Grim data also suggest that there are significant Australian PFC-218 and PFC-318 emissions, the former increasing from about 10 tonnes in the mid-2000s to peak at 17 tonnes in 2010-2011, declining to 9 tonnes from 2015-2017 and the latter declining from nearly 30 tonnes in 2009 to 10-11 tonnes in 2016-2017. The sources of PFC-218 and PFC-318 are unknown; there are no significant PFC-218 or PFC-318 imports recorded. The PFC-218 emissions are about the same size as the non-aluminium PFC-116 emissions, with a similar growth pattern. This suggests their emissions may be related.
Comparisons of NGA, ISC and NAME emission estimates
As mentioned in section 4, the HFC Inventory estimates for 2006-2017 have been revised in the National Inventory Report 2017 (DoEE, 2019). Two significant changes have been implemented for determining the HFC emissions. The first change is that the annual leak rates are calibrated to the CSIRO HFC emissions estimates for all equipment types from 2006 onwards. The second change to the method is CSIRO species data is used to modify the species percentages each year from 2006 onwards.
HFC-134a
The major HFC in the Inventory (ageis.climatechange.gov.au; DoEE, 2019) is HFC-134a, with emissions in 2017 of 2966 tonnes (Table 3). Based on Cape Grim data, Australian emissions of HFC-134a in 2017 were 1416 tonnes (ISC), 52% lower than reported in the Inventory (Table 3, Figure 4). For the 12-year period 2006-2017, the average Australian emissions of HFC-134a calculated from Cape Grim data (ISC, 1588 tonnes/yr) are about 35% lower than the Inventory (2145 tonnes/yr; DoEE, 2019).
Cape Grim data suggest that Australian emissions of HFC-134a have grown significantly (24%) over the period 2006-2015, but are now in decline, decreasing 22% from 2015-2017. The Inventory show increasing emissions through to 2017, with emissions growing by 100% from 2006-2017. Over the period 2006-2017, Cape Grim data suggest total HFC-134a emissions of 20 k tonnes (ISC) compared to the Inventory total of 28 k tonnes which is a factor of 1.4 higher. This is a big improvement from the previous report (Dunse et al., 2018; a factor of 2.3 higher). The ISC and InTEM total agree to within 13%. The revised Inventory estimates (see section 4) better reflect the year to year variability of the use of individual HFCs and the difference in magnitude between the Cape Grim estimates and the Inventory estimates has been reduced. However, the Inventory estimates are still substantially larger than Cape Grim estimates for HFC-134a.
Based on atmospheric data, global emissions of HFC-134a were 241 k tonnes in 2017 (Rigby et al., 2014 and Rigby, unpublished data). Australian emissions are about 0.6% of global emissions based on Cape Grim data, and 1.2% based on Inventory data.
Cape Grim ‘sees’ largely winter emissions of HFC-134a emissions from the Melbourne/Port Phillip region; this could offer a partial explanation of the large difference between Australian emissions of HFC-134a calculated from Cape Grim data and as reported in the Inventory.
HFC-125
The next major HFC emitted into the Australian environment is HFC-125 with current (2017) emissions estimated to be about 1061 tonnes in the Inventory. Based on Cape Grim data, Australian emissions of HFC-125 in 2017 were 493 tonnes (ISC), about 53% lower than the Inventory data. For the 12-year period 2006-2017, the average Australian emissions of HFC-125 calculated from Cape Grim data (ISC, 511 tonnes/yr) are about 29% lower than the Inventory (718 tonnes/yr; DoEE, 2019).
The emissions based on Cape Grim data (493 tonnes in 2017), decreased by 17% compared to 2016 emissions. Emissions appear to have stabilised following a rapid increase in HFC-125 emissions which occurred from 2013-2015 (35%) likely due to the popularity of HFC-125 in new air-conditioning systems as part of the refrigerant blend R410A.
Over the period 2006-2017, Cape Grim data suggest total HFC-125 emissions of 6.6 k tonnes (ISC) compared to the Inventory total of 9.3 k tonnes, a factor of 1.4 higher. As with HFC-134a this is a big improvement from the previous report (Dunse et al., 2018; a factor of 2.3 higher). The ISC and InTEM total agree to within 1.6%.
Based on atmospheric data, global emissions of HFC-125 were 77 k tonnes in 2017 (Rigby et al., 2014 and Rigby unpublished data). Australian emissions are 0.6% of global emissions based on ISC data, and 1.4% based on Inventory data.
HFC-143a
According to the Inventory (Table 3), the next major HFC emitted into the Australian environment is HFC-143a with current (2017) emissions of 659 tonnes. Based on Cape Grim data, Australian emissions of HFC-143a in 2017 were about 330 tonnes (ISC), about 50% lower than the Inventory estimates. For the 12-year period 2006-2017, the average Australian emissions of HFC-143a calculated from Cape Grim data (ISC, 409 tonnes/yr) are about 26% lower than the Inventory (554 tonnes/yr; DoEE, 2019).
Over the period 2006-2017, Cape Grim data suggest total HFC-143a emissions of 5.3 k tonnes (ISC) compared to the Inventory total of 7.2 k tonnes, a factor of 1.4 higher. The ISC and InTEM total agree to within 6%.
Based on atmospheric data, global emissions of HFC-143a were 30 k tonnes in 2017 (Rigby et al., 2014 and Rigby, unpublished data). Australian emissions are about 1.1% of global emissions based on ISC data, and 2.2% based on Inventory data. Simmonds et al. (2015) report growing USA HFC-143a emissions through 2012 (8.5 k tonnes), with no obvious seasonality.
HFC-32
The emissions based on Cape Grim data (216 tonnes in 2017), decreased by 19% compared to 2016 emissions. Emissions appear to have stabilised following a rapid increase in HFC-32 emissions which occurred from 2013-2015 (88%) likely due to the popularity of HFC-32 in new air-conditioning systems on its own and as part of the refrigerant blend R410A. Similarly, the largest increase (35%) in HFC-125 emissions occurred over the same period – HFC-125 also being a component of R410a. Based on Cape Grim data, Australian emissions of HFC-32 in 2017 were about 216 tonnes (ISC), about 54% lower than the Inventory estimate (473 tonnes). For the 12-year period 2006-2017, the average Australian emissions of HFC-32 calculated from Cape Grim data (ISC, 170 tonnes/yr) are about 32% lower than the Inventory (251 tonnes/yr).
Over the period 2006-2017, Cape Grim data suggest total HFC-32 emissions of 2.2 k tonnes (ISC) compared to the Inventory total of 3.3 k tonnes, a factor of 1.5 higher.
Based on atmospheric data, global emissions of HFC-32 were 50 k tonnes in 2017 (Rigby et al., 2014 and Rigby, unpublished data). Australian emissions are 0.4% of global emissions based on ISC data, and 0.9% based on Inventory data.
HFC-152a
The 2017 HFC-152a emissions have been estimated from Cape Grim data at 60 tonnes (ISC), close to 2016 emissions. The data suggest that HFC-152a emissions may have peaked in 2015 at 66 tonnes. Estimates of HFC-152a have been included in the Inventory for the first time this year (DoEE, 2019), with an estimate for 2017 of 108 tonnes. InTEM emissions are available for the period 2005-2011 and average 20% higher than the ISC emissions. For the 12-year period 2006-2017, the average Australian emissions of HFC-152a calculated from Cape Grim data (ISC, 50 tonnes/yr) are about 30% lower than the Inventory (71 tonnes/yr)
The primary uses for HFC-152a are as an aerosol propellant, as an alternative to CFC-11 and CFC-12 in foam expansion and as a component of some refrigerant blends. Imports of HFC-152a into Australia were 25 tonnes in 2017, 21 tonnes in 2018 (Table 2), 45% lower than 2015 imports, consistent with the peak emissions in 2015 shown from the Cape Grim data.
Over the period 2006-2017, Cape Grim data suggest total HFC-152a emissions of 0.65 k tonnes (ISC) compared to the Inventory total of 0.92 k tonnes, a factor of 1.4 higher.
Based on atmospheric data, global emissions of HFC-152a were 55 k tonnes in 2017 (Rigby et al., 2014 and Rigby unpublished data). Australian emissions are about 0.1% of global emissions based on ISC data, and 0.2% based on Inventory data.
HFC-23
HFC-23 emission estimates are estimated in the Inventory to be 46 tonnes in 2017. The 2017 emissions have been estimated from Cape Grim data at 28 tonnes (ISC), dropping steadily from 46 tonnes in 2006. In the 1990s, Australian emissions were estimated as fugitive emissions from Sydney-based Australian HCFC-22 production. HCFC-22 production ceased in Australia in 1995. HFC-23 imports averaged 0.9 tonnes per year from 2011-2016, then imports increased to 3.9 tonnes in 2017 and 8.8 tonnes in 2018. Although emissions of HFC-23 are small compared to the major HFCs (HFC-134a, HFC-143a and HFC-125), continued emissions of HFC-23 have significant potential to contribute to climate forcing due to its large GWP (Global Warming Potential) of 14,800.
For the 12-year period 2006-2017, the average Australian emissions of HFC-23 calculated from Cape Grim data (ISC, 36 tonnes/yr) are about 16% lower than the Inventory (43 tonnes/yr). Over the period 2006-2017, Cape Grim data suggest total HFC-23 emissions of 0.43 k tonnes (ISC) compared to the Inventory total of 0.52 k tonnes, a factor of 1.2 higher.
Based on atmospheric data, global emissions of HFC-23 were 15 k tonnes in 2017 (Rigby et al., 2014 and Rigby, unpublished data). Current Australian emissions are about 0.2% of global emissions based on ISC data, and 0.3% based on the Inventory.
The origin of these Australian HFC-23 emissions is unknown. HFC-23 is a component of the R-508 series of refrigerants, but significant imports of R-508 refrigerants into Australia have not been recorded.
RRA (M. Bennett, private communication, 2014) is not aware of any significant historical use of R-508 refrigerants in Australia. RRA in their refrigerant reclaim operation have collected only one cylinder of R-508 from a CSIRO instrument testing laboratory in Sydney. Thus, it is unlikely that the unaccounted for HFC-23 is from past or current use of R-508 refrigerants in Australia.
Aspendale atmospheric data on HFC-23 (unpublished) and PFC-116 (Kim et al., 2014) show very different concentration/wind direction (so-called concentration ‘roses’) at Aspendale. The PFC-116 data show a clear, strong maximum in the direction (W of Aspendale) of the Pt Henry and Portland smelters, confirming a largely aluminium-production source, and essentially noise in the other wind sectors. The HFC-23 data show a significant, but small concentration maximum in the direction NE of Aspendale (as do HFC-134a, HFC-32, HFC-125 etc.). It would appear that HFC-23 is in the general mix of refrigerant/firefighting emissions from Melbourne, but has not been identified, in any significant amounts, in any Australian imports.
One possible explanation is that HFC-23 (CHF3) is present in refrigerant blends as a contaminant – for example with blends containing HFC-32 (CH2F2). It is possible that overfluorination during the production of HFC-32 could produce HFC-23 and that the resultant refrigerant blends using HFC-32 could contain, likely small, amounts of HFC-23.
The observation that the maximum emissions (46 tonnes, 2006) occurred in the first year of measurements suggests that peak emissions may have been pre-2006. Although global emissions of HFC-23 are on the increase (Stanley et al., 2020), in Australia we see a steady decline in HFC-23 emissions since 2006 (about 5% per year) – if we assume this is from an ‘old’ bank, then the current bank could be of the order of 500 or more tonnes.
HFC-227ea
HFC-227ea is a gaseous fire suppression agent used as a replacement for Halon 1301.The 2017 emissions from Cape Grim data have been estimated at 18 tonnes (ISC), equal to the 2016 emissions. The HFC-227ea emissions are quite variable, ranging from 13 tonnes in 2006 up to a peak of 32 tonnes in 2009. In 2017, 46 tonnes of HFC-227ea were imported into Australia and 20 tonnes were imported in 2018 (Table 2).
HFC-227ea emissions are estimated in the Inventory to be 32 tonnes in 2017. Australian emissions of HFC-227ea from Cape Grim data in 2017 are about 44% lower than the Inventory data. For the 12-year period 2006-2017, the average Australian emissions of HFC-227ea calculated from Cape Grim data (ISC, 22 tonnes/yr) are about 27% lower than the Inventory (30 tonnes/yr).
Over the period 2006-2017, Cape Grim data suggest total HFC-227ea emissions of 0.27 k tonnes (ISC) compared to the Inventory total of 0.37 k tonnes, a factor of 0.7 higher.
There are no InTEM estimates of HFC-227ea emissions from Cape Grim data.
Based on atmospheric data, global emissions of HFC-227ea were 4.9 k tonnes in 2017 (Rigby et al., 2014 and Rigby, unpublished data). Australian emissions are about 0.4% of global emissions based on ISC data and 0.7% based on Inventory data.
HFC-236fa, HFC-245fa, HFC-365mfc
HFC-236fa is a clean agent fire suppressant used as a replacement for Halon 1211 in portable fire extinguisher applications. HFC-245fa is used as a blowing agent for plastic foam insulation and is used as a replacement for HCFC-141b. HFC-365mfc is also used as a blowing agent for plastic foam insulation and is a replacement for HCFC-141b.
The 2017 emissions for HFC-236fa, HFC-245fa and HFC-365mfc have been estimated (ISC) from Cape Grim data at about 3 (steady), 55 (declining) and 38 tonnes (declining) respectively. In 2017, 0.2, 35 and 47 tonnes of HFC-236fa, HFC-245fa and HFC-365mfc respectively were imported into Australia (Table 2); in 2018 the imports were 0.08, 29 and 31 tonnes respectively.
Australian emissions of HFC-236fa from Cape Grim data in 2017 (ISC, 3 tonnes) compare well with the Inventory data (4.5 tonnes). For the 12-year period 2006-2017, the average Australian emissions of HFC-236fa calculated from Cape Grim data (ISC, 4 tonnes/yr) also compare well with the Inventory (5 tonnes/yr). HFC-236fa imports have never exceeded 0.2 tonnes per year, but emissions have averaged 4-5 tonnes per year since 2006 – there must be unrecorded HFC-236fa imports, perhaps from foam.
Australian emissions of HFC-245fa from Cape Grim data in 2017 (ISC, 55 tonnes) are about 55% lower than the Inventory data (123 tonnes). For the 12-year period 2006-2017, the average Australian emissions of HFC-245fa calculated from Cape Grim data (ISC, 46 tonnes/yr) are about 32% lower than the Inventory (68 tonnes/yr). The imports of HFC-245fa are in decline from peak imports of 280 tonnes in 2010.
Australian emissions of HFC-365mfc from Cape Grim data in 2017 (ISC, 38 tonnes) are about 53% lower than the Inventory data (81 tonnes). For the 12-year period 2006-2017, the average Australian emissions of HFC-365mfc calculated from Cape Grim data (ISC, 47 tonnes/yr) are about 29% lower than the Inventory (66 tonnes/yr). The imports of HFC-365mfc are in decline from peak imports of 250 tonnes in 2011.
The imports of HFC-245fa and HFC-365mfc are in decline from peak imports of 200-250 tonnes each in 2011. Current emissions (ISC) of HFC-236fa and HFC-365mfc are not inconsistent with imports (total emissions 2015-2017 = 338 tonnes, total imports = 359 tonnes).
InTEM estimates of emissions of HFC-365mfc for the period 2006-2011 are about 18% lower than ISC estimates of emissions over the same period.
Based on atmospheric data, global emissions of HFC-236fa, HFC-245fa and HFC-365mfc were 0.33, 13 and 4.7 k tonnes respectively in 2017 (Rigby et al., 2014 and Rigby, unpublished data). Australian emissions are about 0.9%, 0.4% and 0.8% of global emissions based on Cape Grim data.
Total HFCs
Total HFC emissions (Table 4), based on Cape Grim observations (ISC, InTEM mean) have grown from about 2200 tonnes in 2005 to 3132 tonnes in 2017, an increase of 42%. Total HFC emissions in 2017 are about 44% lower than in the Inventory, with the discrepancy shared fairly equally between the major HFCs. In previous reports in this series the discrepancy between the Cape Grim data and the Inventory was due mainly to differences in the estimates of HFC-134a. Over the period 2006-2017, total HFC emissions in the Inventory are 28% higher than total emissions based on Cape Grim data (ISC/InTEM average).
Total HFC emissions in the Inventory in 2017 are 12.3 Mt CO2-e, higher (around 50%) than emissions (6.0 Mt CO2-e, ISC-InTEM mean) based on Cape Grim data (Table 3, Table 4, Figure 9). Over the period 2006-2017, the total HFC emissions in the Inventory are 110 Mt CO2-e, compared to 78 Mt CO2-e (41% higher) from Cape Grim data (ISC-InTEM).
Based on atmospheric data, global total HFC emissions are 493 k tonnes (Rigby et al., 2014 and Rigby, unpublished data) in 2017. Based on Cape Grim data (ISC-InTEM), Australian emissions are 0.6% of global emissions or 1.1% based on the Inventory data.
For the combined HFCs (-32, -125, -134a, -143a) the Australian Inventory emissions in 2015 were nearly 4900 tonnes.
Sulfur hexafluoride
Sulfur hexafluoride emissions in the Inventory are 7.7 tonnes in 2017, 8.2 tonnes in 2016 (Table 3, Figure 4). Estimates using Cape Grim data (ISC:Table 4, Figure 4) are 68 tonnes in 2005, decreasing to a low of 22 tonnes in 2017, an overall decrease of about 9% per year. In CO2-e terms sulfur hexafluoride emissions have fallen by 0.59 Mt CO2-e, from 1.10 Mt CO2-e in 2005 to 0.51 Mt CO2-e in 2017 based on Cape Grim data, whereas in the Inventory sulfur hexafluoride emissions have fallen by only 0.02 Mt CO2-e, from 0.20 to 0.18 Mt CO2-e over the same period.
Over the period 2006 – 2017, both the Inventory and Cape Grim data show that Australian sulfur hexafluoride emissions are in decline overall (6% decline in the Inventory, 63% seen at Cape Grim), presumably reflecting the actions of Australian electricity distributors to reduce emissions. However, the Inventory sulfur hexafluoride emissions are significantly lower than emissions estimated from Cape Grim data; over the period 2006 to 2017 the sulfur hexafluoride emissions in the inventory average 7 tonnes per year, about a factor of 4 lower than estimates from Cape Grim over the same period (28 tonnes per year).
A recent inversion study, using a hierarchical Bayesian method has been used to derive Australian (and other regions) emissions (Ganesan et al., 2014). Results show Australian emissions in 2012 of 17±9 tonnes. This compares with 22±8 tonnes in 2012 (ISC data), whereas the Inventory reports 6.5 tonnes.
Based on atmospheric data, global emissions of sulfur hexafluoride were 8.9 k tonnes in 2017 (Rigby et al., 2014, Rigby, unpublished data). Australian emissions are about 0.2% of global emissions (ISC), but < 0.1% based on the Inventory data. It would be unusual for Australian emissions of a widely-used industrial chemical to be <0.1% of global emissions.
The Australian sulfur hexafluoride emissions from atmospheric data and in the Inventory, and sulfur hexafluoride import data, are shown in Figure 10.
Sulfuryl fluoride
Based on Cape Grim data, Australian sulfuryl fluoride emissions averaged 20 tonnes/yr from 2005-2009, but then increased to 150 tonnes in 2017 (Table 4, Figure 11). Presumably this reflects a change in grain fumigation practices away from using methyl bromide and phosphine. Global emissions were 3000 tonnes in 2017 (Rigby et al., 2014 and Rigby, unpublished data). Australian emissions are 5% of global emissions. Australia is responsible for 3% of global wheat production, but 10-15% of wheat exports. Sulfuryl fluoride is more closely related to wheat production (grain storage in Australia’s interior) than to wheat export (grain storage at export ports, fumigated with methyl bromide).
In CO2-e terms, sulfuryl fluoride emissions reached 515 k tonnes CO2-e in 2017, compared to 509 k tonnes CO2-e for sulfur hexafluoride, 969 k tonnes CO2-e for PFCs and 6000 k tonnes CO2-e for HFCs. In climate change terms, Australian sulfuryl fluoride emissions are now more than 53% of the radiative forcing of PFCs, and possibly growing quite rapidly.
Total HFCs, PFC and sulfur hexafluoride emissions
Total HFC, PFC and sulfur hexafluoride emissions in CO2-e from Cape Grim data are shown in Table 4 and Figure 12. Total Australian HFC, PFC and sulfur hexafluoride emissions in the Inventory are 12.6 M tonnes CO2-e in 2017, higher (70%) than estimates based on Cape Grim data: 7.4 M tonnes CO2-e (ISC-InTEM). Over the period 2006-2017 the average Inventory estimates are 36% higher than estimates based on Cape Grim data (ISC-InTEM). Over the period 2006-2017, total Australian emissions of HFCs, PFCs and sulfur hexafluoride, based on Cape Grim data (96 Mt CO2-e) are about 17% lower than the same emissions in the Inventory (116 Mt CO2-e). In two categories (PFCs and sulfur hexafluoride) the atmospheric data give higher estimates of emissions than in the Inventory. In the HFC category the atmospheric data give lower estimates of emissions than the Inventory.
Australian total HFC, PFC and sulfur hexafluoride emissions in 2017 from Cape Grim data (3297 tonnes, ISC-InTEM) are 0.6 % of global emissions (517 k tonnes).
Summary
CSIRO, through involvement in the international AGAGE (Advanced Global Atmospheric Gases Experiment) program, has now measured and reported atmospheric concentrations, temporal trends and emissions for eleven HFCs, nine PFCs, sulfur hexafluoride, nitrogen trifluoride, trifluoromethyl sulfur pentafluoride and sulfuryl fluoride, utilizing data from the background atmosphere at Cape Grim, Tasmania. The AGAGE program involves collaborating scientists from the USA, Australia, China, Italy, Korea, Norway, Switzerland and the UK, who operate a global measurement network and, through a variety of modelling initiatives, estimate lifetimes and emissions of all the significant non-CO2 GHGs, from both ozone depletion and climate forcing perspectives.
All HFCs, all PFCs, sulfur hexafluoride and sulfuryl fluoride, show increasing concentrations in the background atmosphere at Cape Grim, which is consistent with global background atmospheric changes. Significant increases from 2017-2018 (ppt per year) are seen in HFC-134a (6.2), HFC-125 (3.0), HFC-143a (1.7), HFC-32 (2.7), HFC-23 (1.21), PFC-14 (0.95), sulfur hexafluoride (0.36) and sulfuryl fluoride (0.11). Total HFCs are growing at 15 ppt per year or 8% per year, total anthropogenic PFCs at 0.95 ppt per year (1.9% per year), sulfur hexafluoride at 3.9% per year and sulfuryl fluoride at 4.9% per year.
Total global HFC, PFC, sulfur hexafluoride and nitrogen trifluoride emissions have risen from about 30 k tonnes per year in the late 1970s to around 467 k tonnes per year in 2016.
HFC imports into Australia in 2018 were 20% lower than imports in 2017. This reduction is in line with Australia’s mandated HFC production and import phase down which began in 1 January 2018. Sulfur hexafluoride imports in 2018 were 37% lower than 2017. Less than 1 tonne of PFCs are imported into Australia. The quantity of sulfuryl fluoride imported each year into Australia depends on the annual grain harvest, but is currently around 150 tonnes per year.
The National Greenhouse Accounts (Inventory) reports significant Australian annual (2017) emissions of HFC-134a (2966 tonne), HFC-125 (1061 tonne), HFC-143a (659 tonne), HFC-32 (473 tonne), HFC-245fa (123 tonne), HFC-152a (108 tonne), HFC-23 (46 tonne), HFC-227ea (32 tonne), PFC-14 (18 tonne), sulfur hexafluoride (8 tonne), PFC-116 (5.6 tonne) and HFC-236fa (4.5 tonne). Emissions of the majority of HFCs are increasing. The Inventory emissions calculations for HFCs have been revised for the 2019 Inventory using CSIRO data to calibrate leakage rates and to modify the species percentages. Emissions of PFCs (from aluminium production only) in the Inventory have declined 72% from 2006-2017. Overall the emissions of HFCs, PFCs and sulfur hexafluoride are increasing due to the dominant influence of HFC emissions.
Regional Australian emissions have been detected in the Cape Grim data for all HFCs, the first four PFCs listed above, sulfur hexafluoride and sulfuryl fluoride. The emissions have been quantified using a variety of modelling techniques, including interspecies correlation (ISC), forward modelling using the CSIRO TAPM model and inverse modelling using the UK Meteorological Office transport model NAME and inversion model InTEM. Australian emissions of all the major HFCs (except HFC-23) decreased from 2016 to 2017. Overall the major HFCs have decreased by 15% from 2016-2017. Total HFCs (major and minor) also decreased by 15% from 2016-2017. It is not yet clear why there was a substantial drop in HFC emissions from 2016-2017, as the HFC phase-down was not yet enacted. Decreases were seen in HFC-32 (19%), HFC-125 (17%), HFC-134a (15%), HFC-143a (11%) and HFC-32 (2%).
Emissions of all the minor HFCs have been detected in the Cape Grim data. A few episodes of HFC-4310mee have been detected, but not enough to estimate emissions. Emissions of two of the minor HFCs have decreased from 2016-2017 with HFC-245fa decreasing by 19% and HFC-365mfc decreasing by 17%. HFC-227ea emissions remained steady and HFC-236fa emissions increased by 50%.
Total HFC emissions in 2017 from Cape Grim data are about 44% lower than in the Inventory, with the discrepancy shared fairly equally between the major HFCs. In previous reports in this series the discrepancy between the Cape Grim data and the Inventory was due mainly to differences in the estimates of HFC-134a. Over the period 2006-2017, total HFC emissions in the Inventory are 28% higher than total emissions based on Cape Grim data (ISC/InTEM average).
The Inventory shows Australian total HFC emissions continuing to grow.
Cape Grim data show total HFC emissions growing until 2016. The Cape Grim data show that total HFC emissions were 7% lower in 2017 compared to 2016. Whether this represents some stabilization in emissions will be resolved with further data in the next few years.
Total HFC emissions in the Inventory in 2017 are 12.3 Mt CO2-e, higher (around 50%) than emissions (6.0 Mt CO2-e, ISC-InTEM mean) based on Cape Grim data. Over the period 2006-2017, the total HFC emissions in the Inventory are 110 Mt CO2-e, compared to 78 Mt CO2-e (41% higher) from Cape Grim data (ISC-InTEM).
Over the period 2006 – 2017, both the Inventory and Cape Grim data show that Australian sulfur hexafluoride emissions are in decline overall (6% decline in the Inventory, 63% seen at Cape Grim), presumably reflecting the actions of Australian electricity distributors to reduce emissions. However, the Inventory sulfur hexafluoride emissions are significantly lower than emissions estimated from Cape Grim data.
Australian sulfuryl fluoride emissions from Cape Grim data (ISC only) have grown rapidly from 9 tonnes in 2005 up to 122 tonnes in 2017. This presumably reflects a change in grain fumigation practices away from using methyl bromide and phosphine to sulfuryl fluoride.
PFC-14 and PFC-116 emissions from the aluminium industry have been estimated using InTEM and TAPM (PFC-116 indirectly via PFC-14). Over the period 2006-2017, PFC-14 emissions in the Inventory are in decline and are about 50% lower than PFC-14 emissions estimated from Cape Grim data (TAPM-InTEM). Emissions of PFC-14 using Cape Grim data have been steady at about 60 tonnes for the period 2012-2015, but increased significantly to 103 tonnes in 2016 and 90 tonnes in 2017, 5 times the Inventory estimate. The fraction of Australian PFC-14 emission seen at Cape Grim has declined significantly since the closure of the Point Henry smelter in 2014. The 2016 and 2017 increase in PFC-14 emissions is largely due to increases seen at the Bell Bay smelter. This result will need to be confirmed when InTEM emission estimates are updated.
Over the period 2006-2017, PFC-116 emissions in the Inventory (assumed only from the aluminium industry) have declined by 44% and are on average about 36% lower than PFC-116 emissions estimated from Cape Grim data (TAPM-InTEM).
Cape Grim observations show that Australian emissions of PFC-218 were growing until 2011, but are now declining, with current (2017) emissions for PFC-218 about 9 tonnes. PFC-318 emissions vary from 10-12 tonnes over the last 5 years. There are no significant Australian imports identified for these PFCs. Globally PFC-218 and PFC-318 are used in the electronics industry (etching), in refrigeration, in fire suppression and in medical applications.
Total Australian PFC emissions (from Cape Grim data) declined from 2005 to 2008, largely driven by emissions from the aluminium industry. From 2008 to 2017 emissions varied from 76 – 132 tonnes per year (119 tonnes in 2017). Total Australian PFC emissions from the Inventory have declined by 72% from 2006 to 2017.
Total Australian HFC, PFC and sulfur hexafluoride emissions, expressed as CO2-e emissions, over the period 2006-2017 estimated from Cape Grim data (96 Mt CO2-e) are about 17% lower than the same emissions in the Inventory (116 Mt CO2-e).
Average Australian HFC, PFC and sulfur hexafluoride emissions (tonnes) over the period 2006-2017 from the Inventory are 36% higher than estimates based on Cape Grim data (ISC-InTEM).
Importantly, Cape Grim data suggest that the combined Australian emissions of HFCs, PFCs and sulfur hexafluoride, which peaked in 2009 and plateaued over the period 2009-2014 at 2900 tonnes per year, reached a new maximum of about 3500 tonnes in 2016 and then declined in 2017 to 3300 tonnes; the Inventory shows that emissions have continued to grow through 2017 to 5588 tonnes.
Appendix A
NAME (Numerical Atmospheric Dispersion Modelling Environment) is a Lagrangian particle dispersion model driven by 3-dimensional wind fields from numerical weather predictions models. NAME has a horizontal resolution (grid boxes 40 km x 40 km) and a minimum boundary layer height of 100 m. NAME operates in a backward mode, so, for example, it identifies, within a 3 hr period at Cape Grim, which grid boxes in the prescribed domain impact on Cape Grim in the previous 12 days. NAME releases 33,000 particles at Cape Grim over the 3 hr period and the resultant 12-day integrated concentrations in each of the domain boxes are calculated. Operating NAME in the backward mode is numerically very efficient and is a very close approximation to the forward running mode, which is what is used to identify emission sources impacting on Cape Grim. The NAME model is coupled to the InTEM inversion model (O’Doherty et al., 2009; Manning et al., 2003, 2011; Redington and Manning, 2018)
In the inverse calculation, InTEM identifies pollution episode data at Cape Grim, and starts with randomly-generated emission maps and searches for the emission map that leads to a modelled pollution time series that most accurately mimics the observations. The inversion method assumes that baseline air enters the inversion domain regardless of direction i.e. it assumes that sources outside the specified domain do not impact significantly on Cape Grim. For the 2018 InTEM inversions, emissions were calculated for the Victoria/Tasmania/New South Wales domain and, for the 2011 InTEM inversions, a Victoria/Tasmania domain was used.
References
Arnold, T., C. M. Harth, J. Mühle, A. J. Manning, P. K. Salameh, J. Kim, D. J. Ivy, L. P. Steele, V. V. Petrenko, J. P. Severinghaus, D. Baggenstos and R. F. Weiss, Nitrogen trifluoride global emissions estimated from updated atmospheric measurements, PNAS, 110(6), 2029-2034, doi:10.1073/pnas.1212346110, 2013.
Arnold, T., D. J. Ivy, C. M. Harth, M. K. Vollmer, J. Mühle, P. K. Salameh, L. P. Steele, P. B. Krummel, R. H. J. Wang, D. Young, C. R. Lunder, O. Hermansen, T. S. Rhee, J. Kim, S. Reimann, S. O’Doherty, P. J. Fraser, P. G. Simmonds, R. G. Prinn and R. F. Weiss, HFC-43-10mee atmospheric abundances and global emission estimates, Geophys. Res. Lett., 41(6), 2228-2235, doi:10.1002/2013GL059143, 2014.
Brodribb, P. and M. McCann, Assessment of environmental impacts from the Ozone Protection and Synthetic Greenhouse Gas Management Act 1989, Expert Group, Canberra, ACT, Australia, for the DoE, April 2015.
Brunner, D., T. Arnold, S. Henne, A. Manning, R. L. Thompson, M. Maione, S. O’Doherty and S. Reimann, Comparison of four inverse modelling systems applied to the estimation of HFC-125, HFC-134a and SF6 emissions over Europe, Atmos. Chem. Phys., 17 (17), 10651-10674, doi:10.5194/acp-17-10651-2017, 2017.
Daniel, J. and G. Velders, A Focus on Information and Options for Policymakers, Chapter 5 in Scientific Assessment of Ozone Depletion: 2010, WMO Global Ozone Research and Monitoring Project – Report No. 52, 5.1-5.56, 2011.
DoE 2016, National Inventory Report 2014 and Revised Kyoto Protocol National Inventory Report 2013, Volume 1, Australian Government Department of the Environment, May 2016, 344 pp.
DoEE 2017, National Inventory Report 2015, Volume 1, Australian Government Department of the Environment and Energy, Commonwealth of Australia, May 2017, 347 pp.
DoEE 2018, National Inventory Report 2016, Volume 1, Australian Government Department of the Environment and Energy, Commonwealth of Australia, April 2018, 356 pp.
DoEE 2019, National Inventory Report 2017, Volume 1, Australian Government Department of the Environment and Energy, Commonwealth of Australia, May 2019, 359 pp
Dunse, B. L., L. P. Steele, P. J. Fraser and S. R. Wilson, An analysis of Melbourne pollution episodes observed at Cape Grim from 1995-1998, Baseline Atmospheric Program (Australia) 1997-98, N. W. Tindale, N. Derek and R. J. Francey (eds.), Bureau of Meteorology and CSIRO Atmospheric Research, Melbourne, Australia, 34-42, 2001.
Dunse, B. L., Investigation of urban emissions of trace gases by use of atmospheric measurements and a high-resolution atmospheric transport model, PhD thesis, University of Wollongong, Wollongong, NSW, Australia, 2002.
Dunse, B.L., L.P. Steele, S.R. Wilson, P.J. Fraser and P. B. Krummel, Trace gas emissions from Melbourne, Australia, based on AGAGE observations at Cape Grim, Tasmania, 1995-2000, Atmos. Environ., 39(34), 6334-6344, doi:10.1016/j.atmosenv.2005.07.014, 2005.
Dunse, B. L., N. Derek, P. J. Fraser, P. B. Krummel and L. P. Steele, Australian and global HFC, PFC, sulfur hexafluoride nitrogen trifluoride and sulfuryl fluoride emissions, Report prepared for Australian Government Department of the Environment and Energy, CSIRO Oceans and Atmosphere, Aspendale, Australia, iv, 33 pp., 2018.
Draxler, R. and D. Hess, Description of the HYSPLIT_4 Modeling 389 System, NOAA Technical Memorandum ERL ARL-224, 24 pp, NOAA, 1997.
Droste, E., K. E. Adcock, M. J. Ashfold, C. Chou, P. J. Fraser, L. J. Gooch, A. J. Hind, R. L. Langenfelds, E. C. Leedham Elvidge, S. O’Doherty, D. E. Oram, C.-F. Ou-Yang, C. E. Reeves, W. T. Sturges, and J. C. Laube, Long-term trends and emissions of seven perfluorocarbon compounds in the southern and northern hemisphere, EGU General Assembly 2018, 8-13 April 2018, Vienna, Austria, European Geosciences Union, Munich, Germany, Geophysical Research Abstracts, 20, EGU2018-8926, 2018.
Engel, A. and M. Rigby (Lead Authors), J.B. Burkholder, R.P. Fernandez, L. Froidevaux, B.D. Hall, R. Hossaini, T. Saito, M.K. Vollmer, and B. Yao, Update on Ozone-Depleting Substances (ODSs) and Other Gases of Interest to the Montreal Protocol, Chapter 1 in Scientific Assessment of Ozone Depletion: 2018, Global Ozone Research and Monitoring Project – Report No. 58, World Meteorological Organization, Geneva, Switzerland, 2018.
Estrada, F., P. Perron and B. Martínez-López, Statistically derived contributions of diverse human influences to twentieth-century temperature changes, Nature Geosci., 6(11), 1050-1055, doi:10.1038/ngeo1999, 2013.
Fortems-Cheiney, A., M. Saunois, I, Pison, F. Chevallier, P. Bousquet, C. Cressot, S. Montzka, P. Fraser, M. Vollmer, P. Simmonds, D. Young, S. O’Doherty, R. Weiss, F. Artuso, B. Barletta, D. Blake, S. Li, C. Lunder, B. Miller, S. Park, R. Prinn, T. Saito, P. Steele and Y. Yokouchi, Increase in HFC-134a emissions in response to the success of the Montreal Protocol, J. Geophys. Res., 120, 11728-11742, doi:10.1002/2015JD023741, 2015
Fraser, P. J., L. W. Porter, S. B. Baly, P. B. Krummel, B. L. Dunse, L. P. Steele, N. Derek, R. L. Langenfelds, I. Levin, D. E. Oram, J. W., Elkins, M. K., Vollmer and R. F. Weiss, Sulfur hexafluoride at Cape Grim: long term trends and regional emissions, Baseline Atmospheric Program (Australia) 2001-2002, J. M. Cainey, N. Derek and P. B. Krummel (eds.), Bureau of Meteorology and CSIRO Atmospheric Research, Melbourne, Australia, 18-23, 2004.
Fraser, P., C. Trudinger, B. Dunse, P. Krummel, P. Steele, D. Etheridge, N. Derek, L. Porter and B. Miller, PFC emissions from global and Australian aluminium production, Proceedings of the 9th Australasian Aluminium Smelting Technology Conference and Workshops, Skyllas-Kazacos, M. and B. Welch (eds.), 4-9 November 2007, Terrigal, Australia, School of Chemical Engineering, UNSW, Sydney, ISBN:9780733425561, ©2007.
Fraser, P., B. Dunse, L. P. Steele, P. B. Krummel and N. Derek, Perfluorocarbon (PFC) emissions from Australian aluminium smelters, 2005-2009, Proceedings of the 10th Australasian Aluminium Smelting Technology Conference, 9-14 October, 2011, Launceston, Australia, B. Welch, G. Stephens, J. Metson and M. Skyllos-Kazacos (eds.), School of Chemical Engineering, UNSW, Sydney, ISBN:978-0-7334-3054-1, 14 pp., ©2011
Fraser. P., P. Steele and M. A. Cooksey, PFC and CO2 emissions from an aluminium smelter measured using integrated stack sampling, GC-MS and GC-FID, Light Metals 2013, B. Sadler (ed.), Wiley/TMS 2013, 871-876, 2013.
Fraser, P. J., P. B. Krummel, L. P. Steele, C. M. Trudinger, D. M. Etheridge, N. Derek, S. O’Doherty, P. G. Simmonds, B. R. Miller, J. Mühle, R. F. Weiss, D. E. Oram, R. G. Prinn and R. H. J. Wang, Equivalent effective stratospheric chlorine from Cape Grim Air Archive, Antarctic firn and AGAGE global measurements of ozone depleting substances, Baseline Atmospheric Program (Australia) 2009-2010, N. Derek P. B. Krummel and S. J. Cleland (eds.), Australian Bureau of Meteorology and CSIRO Marine and Atmospheric Research, Melbourne, Australia, 17-23, 2014a
Fraser, P. J., B. L. Dunse, A. J. Manning, R. H. J. Wang, P. B. Krummel, L. P. Steele, L. W. Porter, C. Allison. S. O’Doherty, P. G. Simmonds, J. Mühle and R. G. Prinn, Australian carbon tetrachloride (CCl4) emissions in a global context, Environ. Chem., 11, 77-88, doi:10.1071/EN13171, 2014b.
Fraser, P. J., L. P. Steele, G. I. Pearman, S. Coram, N. Derek, R. L. Langenfelds and P. B. Krummel, Non-carbon dioxide greenhouse gases at Cape Grim: a 40 year odyssey, Baseline Atmospheric Program (Australia) History and Recollections, 40th Anniversary Special Edition, Derek, N., P. B. Krummel and S. J. Cleland (eds.), Bureau of Meteorology/CSIRO Oceans and Atmosphere, ISSN 0155-6959, 45-76, 2016.
Fraser, P. J., G. I. Pearman and N. Derek, CSIRO non-carbon dioxide greenhouse gas research. Part 1: 1975-1990, Historical Records of Australian Science, 28, 1-13, doi.10.1071/HR17016, 2018.
Ganesan, A. L., M. Rigby, A. Zammit-Mangion, A. J. Manning, R. G. Prinn, P. J. Fraser, C. M. Harth, K.-R. Kim, P. B. Krummel, S. Li, J. Mühle, S. J. O’Doherty, S. Park, P. K. Salameh, L. P. Steele and R. F. Weiss, Characterization of uncertainties in trace gas inversions using hierarchical Bayesian methods, Atmos. Chem. Phys., 14(8), 3855-3864, doi:10.5194/acp-14-3855-2014, 2014.
Graziosi, F., J. Arduini, F. Furlani, U. Giostra, P. Cristofanelli, X. Fang, O. Hermanssen, C. Lunder, G. Maenhout, S. O’Doherty, S. Reimann, N. Schmidbauer, M. K. Vollmer, D. Young and M. Maione, Europeam emissions of the powerful greenhouse gaseshydrofluorocarbons inferred from atmospheric measurementsand their comparison with annual national reports to UNFCCC, Atmos. Environ., 158, 85-97, doi:10.1016/jatmosenv,2017.03.029, 2017.
Greally, B. R., A. J. Manning, S. Reimann, A. McCulloch, J. Huang, B. L. Dunse, P. G. Simmonds, R. G. Prinn, P. J. Fraser, D. M. Cunnold, S. O’Doherty, L. W. Porter, K. Stemmler, M. K. Vollmer, C. R. Lunder, N. Schmidbauer, O. Hermansen, J. Arduini, P. K. Salameh, P. B. Krummel, R. H. J. Wang, D. Folini, R. F. Weiss, M. Maione, G. Nickless, F. Stordal and R. G. Derwent, Observations of 1,1-difluoroethane (HFC-152a) at AGAGE and SOGE monitoring stations in 1994-2004 and derived global and regional emission estimates, J. Geophys. Res. – Atmos., 112, D06308, doi:10.1029/2006JD007527, 2007.
Harris, N., D. Wuebbles (Lead Authors), J. Daniel, J. Hu, L. Kuijpers, K. Law, M. Prather and R. Schofield, Scenarios and Information for Policy Makers, Chapter 5 in Scientific Assessment of Ozone Depletion: 2014, Global Ozone and Monitoring Project – Report no. 55, 5.1-5.58, WMO, Geneva, Switzerland, 2014.
Hu, L., S. A. Montzka, S. L. Lehman, D. S. Godwin, B. R. Miller, A. E. Andrews, K. Thoning, J. B. Miller, C. Sweeney, C. Siso, J. W. Elkins, B. D. Hall, D. J. Mondeel, D. Nance, T. Nehrkorn, M. Mountain, M. L. Fischer, S. C. Biraud, H. Chen and P. P. Tans, Considerable contribution of the Montreal Protocol to declining greenhouse gas emissions from the United States, Geophys. Res. Lett., 44, doi:10.1002/2017GL074388, 2017.
Hurwitz, M. M., E. L. Fleming, P. A Newman, F. Li, E. Mlawer, K. Cady-Pereira and R. C. G. L. Bailey, Ozone depletion by hydrofluorocarbons, Geophys. Res. Lett., 42 (20), 8686-8692, doi:10.1002.2015gl065856, 2015.
Ivy, D. J., Trends and inferred emissions of atmospheric high molecular weight perfluorcarbons, PhD thesis, MIT, Cambridge, Massachusetts, USA, 2012.
Ivy, D. J., T. Arnold, C. M. Harth,L. P. Steele, J. Mühle, M. Rigby, P. K. Salameh, M. Leist, P. B. Krummel, P. J. Fraser, R. F. Weiss and R. G. Prinn, Atmospheric histories and growth trends of the high molecular weight perfluorocarbons: C4F10, C5F12, C6F14, C7F16 and C8F18, Atmos. Chem. Phys., 12(9), 4313-4325, doi:10.5194/acp-12-4313-2012, 2012.
Kim, J., P. J. Fraser, S. Li, J. Mühle, A. L. Ganesan, P. B. Krummel, L. P. Steele, S. Park, S.-K. Kim, M.-K. Park, T. Arnold, C. M. Harth, P. K. Salameh, R. G. Prinn, R. F. Weiss and K.-R. Kim, Quantifying aluminium and semiconductor industry perfluorocarbon emissions from atmospheric measurements, Geophys. Res. Lett., 41(13), 4787-4794, doi:10.1002/2014GL059783, 2014.
Krummel, P. B., P. J. Fraser, L. P. Steele, N. Derek, C. Rickard, J. Ward, N. T. Somerville, S. J. Cleland, B. L. Dunse, R. L. Langenfelds, S. B. Baly and M. Leist, The AGAGE in situ program for non-CO2 greenhouse gases at Cape Grim, 2009-2010, Baseline Atmospheric Program (Australia) 2009-2010, N. Derek P. Krummel and S. Cleland (eds.), Australian Bureau of Meteorology and CSIRO Marine and Atmospheric Research, Melbourne, Australia, 55-70, 2014
Laube, J. C., C. Hogan, M. J. Newland, F. S. Mani, P. J. Fraser, C. A. M. Brenninkmeijer, P. Martinerie, D. E. Oram, T. Röckmann, J. Schwander, E. Witrant, G. P. Mills, C. E. Reeves and W. T. Sturges, Distributions, long term trends and emissions of four perfluorocarbons in remote parts of the atmosphere and firn air, Atmos. Chem. Phys., 12, 4081-4090, doi:10.5194/acp-12-4081-2012, 2012.
Leedham Elvidge, E., H. Bönisch, C. A. M. Brenninkmeijer, A. Engel, P. J. Fraser, E. Gallacher, R. Langenfelds, J. Mühle, D. E. Oram, E. A. Ray, A. R. Ridley, T. Röckmann, W. T. Sturges, R. F. Weiss and J. C. Laube, Evaluation of stratospheric age-of-air from CF4, C2F6, C3F8, CHF3, HFC-125, HFC-227ea and SF6; implications for the calculations of halocarbon lifetimes, fractional release factors and ozone depletion potentials, Atmos. Chem. Phys., 18, 3369-3385, doi:10.5194/acp-18-3369-2018, 2018.
Levin, I., T. Naegler, R. Heinz, D. Osusko, E. Cuevas, A. Engel, J. Ilmberger, R. Langenfelds, B. Neininger, C. Rohden, P. Steele, R. Weller, D. Worthy and S. Zimov, Atmospheric observation-based global SF6 emissions – comparison of top-down and bottom-up estimates, Atmos. Chem. Phys., 10, 2655-2662, doi:10.5194/acpd-9-26653-2009, 2010.
Liang, Q., M. P. Chipperfield, E. L. Flemimg, N. L. Abraham, P. Braesicke, J. B. Burkholder, J. S. Daniel, S. Dhmosa, P. J. Fraser, S. C. Hardiman, C. H. Jackman, D. E. Kinnison, P. B. Krummel, S. A. Montzka, O. Morgenstern, A. McCulloch, J. Mühle, P. A. Newman, V. L. Orkin, G. Pitari, R. G. Prinn, M. Rigby, E. Razanov, A. Stenke, F. Tummon, G. J. M. Velders, D. Visioni and R. F. Weiss, Deriving global OH abundance and atmospheric lifetimes for long-lived gases: a search for CH3CCl3 alternatives, J. Geophys. Res. – Atmos., 122, 11914-11933, doi:10.1002/2017JD026926, 2017.
Lunt, M. F., M. Rigby, A. L. Ganesan, A. J. Manning, R. G. Prinn, S. O’Doherty, J. Mühle, C. M. Harth, P. K. Salameh, T. Arnold, R. F. Weiss, T. Saito, Y. Yokouchi, P. B. Krummel, L. P. Steele, P. J. Fraser, S. Li, S. Park, S. Reimann, M. K. Vollmer, C. Lunder, O. Hermansen, N. Schmidbauer, M. Maione, J. Arduini, D. Young and P. G. Simmonds, Reconciling reported and unreported HFC emissions with atmospheric observations, Proc. Natl. Acad. Sci., 112(19), 5927-5931, doi:10.1073/pnas.1420247112, 2015.
Maiss, M., L. P. Steele, R. J. Francey, P. J. Fraser, R. L. Langenfelds, N. B. A. Trivett and I. Levin, Sulfur hexafluoride: a powerful new atmospheric tracer, Atmos. Environ., 30 (10/11), 1621-1629, doi:10.1016/1352-2310(95)00425-4, 1996.
Manning, A. J., D. B. Ryall, R. G. Derwent, P. G. Simmonds and S. O’Doherty, Estimating European od ozone depleting and greenhouse gases using observations and a modelling back-attribution technique, J. Geophys. Res. – Atmos., 108(D14), 4405, doi:10.1029/2002JD002312, 2003.
Manning, A. J., S. O’Doherty, A. R. Jones, P. G. Simmonds and R. G. Derwent, Estimating UK methane and nitrous oxide emissions from 1990 to 2007 using an inversion modeling approach, J. Geophys. Res. – Atmos., 116, D02305, doi:10.1029/2010JD014763, 2011.
Manning, A., A. Redington, S. O’Doherty, K. Stanley, D. Young, P. Krummel, P. Fraser, B. Mitrevski, B. Yao and S. Park, Use of inverse modelling (InTEM) to support national inventory reporting, AGAGE 57, Beijing, China, 6-12 May 2018.
Meinshausen, M., E. Vogel, A. Nauels, K. Lorbacher, N. Meinshausen, D. Etheridge, P. Fraser S. Montzka, P. Rayner, C. Trudinger, P. Krummel, U. Beyerle, P. Canadell, J. Daniel, I. Enting, R. Law, C. Lunder, S. O’Doherty, R. Prinn, S. Reimann, M. Rubino, G. Velders, M. Vollmer, R. Wang and R. Weiss, Historical greenhouse gas concentrations for climate modelling (CMIP6), Geosci. Model Dev., 10, 2015-2116, doi:10.5194/gmd-10-2087-2017, 2017.
Miller, B. R., M. Rigby, L. J. M. Kuijpers, P. B. Krummel, L. P. Steele, M. Leist, P. J. Fraser, A. McCulloch, C. Harth, P. Salameh, J. Mühle, R. F. Weiss, R. G. Prinn, R. H. J. Wang, S. O’Doherty, B. R. Greally and P. G. Simmonds, CHF3 (HFC-23) emission trend response to CHClF2 (HCFC-22) production and recent CHF3 emissions abatement measures, Atmos. Chem. Phys., 10(16), 7875-7890, doi:10.5194/acp-10-7875-2010, 2010.
Molina, M., D. Zaelke, K. Sharma, S. O. Andersen, V. Ramanathan and D. Kaniaru, Reducing abrupt climate change risk using the Montreal Protocol and other regulatory actions to complement cuts in CO2 emissions, Proc. Natl. Acad. Sci., 106(49), 20615-20621, doi:10.1073/pnas.0902568106, 2009.
Montzka, S. A., G. J. M. Velders, P. B. Krummel, J. Muhle, V. L. Orkin, S. Park, H. Walter-Terronini and N. Shah, Hydrofluorocarbons (HFCs), Chapter 2 in Scientific Assessment of Ozone Depletion: 2018, World Meteorological Organization, Global Ozone Research and Monitoring Project – Report No. 58, 67 pp., Geneva, Switzerland, 2018.
Mühle, J., J. Huang, R. F. Weiss, R. G. Prinn, B. R. Miller, P. K. Salameh, C. M. Harth, P. J. Fraser, L. W. Porter, B. R. Greally, S. O’Doherty, P. G. Simmonds, P. B. Krummel and L. P. Steele, Sulfuryl fluoride in the global atmosphere, J. Geophys. Res. – Atmos., 114, D05306, doi:10.1029/2008JD011162, 2009.
Mühle, J., A. L. Ganesan, B. R. Miller, P. K. Salameh, C. M. Harth, B. R. Greally, M. Rigby, L. W. Porter, L. P. Steele, C. M. Trudinger, P. B. Krummel, S. O’Doherty, P. J. Fraser, P. G. Simmonds, R. G. Prinn and R. F. Weiss, Perfluorocarbons in the global atmosphere: tetrafluoromethane, hexafluoroethane and octofluoropropane, Atmos. Chem. Phys., 10(11), 5145-5164, doi:10.5194/acp-10-5145-2010, 2010.
Myhre, G., D. Schindell, F.-M. Breon, W. Collins, J. Fuglestvedt, J. Huang, D. Koch, J.-F. Lamarque, D. Lee, B. Mendoza, T. Nakajima, A. Robock, G. Stephens, T. Takemura, and H. Zhang, Anthropogenic and Natural Radiative Forcing, Chapter 8 in Climate Change 2013 – The Physical Science Basis, Working Group I Contribution to the Fifth Assessment Report of the Intergovernmental Panel on Climate Change, Stocker, T., D. Qin, G.-K. Plattner, M. Tignor, S. Allen, J. Boschung, A. Nauels, Y. Xia, V. Bex and P. Midgley (eds.), Cambridge University Press, Cambridge, UK and New York, NY, USA, 659-740, 2014.
O’Doherty, S., D. M. Cunnold, A. Manning, B. R. Miller, R. H. J. Wang, P. B. Krummel, P. J. Fraser, P. G. Simmonds, A. McCulloch, R. F. Weiss, P. Salameh, L. W. Porter, R. G. Prinn, J. Huang, G. Sturrock, D. Ryall, R. G. Derwent and S. A. Montzka, Rapid growth of hydrofluorocarbon-134a and hydrochlorofluorocarbons-141b, -142b, and -22 from Advanced Global Atmospheric Gases Experiment (AGAGE) observations at Cape Grim, Tasmania, and Mace Head, Ireland, J. Geophys. Res. – Atmos., 109, D06310, doi:10.1029/2003JD004277, 2004.
O’Doherty, S., D. M. Cunnold, B. R. Miller, J. Mühle, A. McCulloch, P. G. Simmonds, A. J. Manning, S. Reimann, M. K. Vollmer, B. R. Greally, R. G. Prinn, P. J. Fraser, L. P. Steele, P. B. Krummel, B. L. Dunse, L. W. Porter, C. R. Lunder, N. Schmidbauer, O. Hermansen, P. K. Salameh, C. M. Harth, R. H. J. Wang and R. F. Weiss, Global and regional emissions of HFC-125 (CHF2CF3) from in situ and air archive observations at AGAGE and SOGE observatories, J. Geophys. Res. – Atmos., 114, D23304, doi:10.1029/2009JD012184, 2009.
O’Doherty, S., M. Rigby, J. Mühle, D. J. Ivy, B. R. Miller, D. Young, P. G. Simmonds, S. Reimann, M. K. Vollmer, P. B. Krummel, P. J. Fraser, L. P. Steele, B. Dunse, P. K. Salameh, C. M. Harth, T. Arnold, R. F. Weiss, J. Kim, S. Park, S. Li, C. Lunder, O. Hermansen, N. Schmidbauer, L. X. Zhou, B. Yao, R. H. J. Wang, A. J. Manning and R. G. Prinn, Global emissions of HFC-143a (CH3CF3) and HFC-32 (CH2F2) from in situ and air archive atmospheric observations, Atmos. Chem. Phys., 14(17), 9249-9258, doi:10.5194/acp-14-9249-2014, 2014.
Oram, D. E., C. E. Reeves, W. T. Sturges, S. A. Penkett, P. J. Fraser and R. L. Langenfelds, Recent tropospheric growth rate and distribution of HFC-134a (CF3CH2F), Geophys. Res. Lett., 23(15), 1949-1952, doi:10.1029/96GL0186, 1996.
Oram, D. E., W. T. Sturges, S. A. Penkett, A. McCulloch and P. J. Fraser, Growth of fluoroform (CHF3, HFC-23) in the background atmosphere, Geophys. Res. Lett., 25(1), 35-38, doi:10.1029/97GL03483, 1998.
Oram, D. E., Trends in long-lived anthropogenic halocarbons in the Southern Hemisphere and model calculations of global emissions, PhD thesis, University of East Anglia, Norwich, UK, 1999.
Oram, D. E., F. S. Mani, J. C. Laube, M. J. Newland, C. E. Reeves, W. T. Sturges, S. A. Penkett, C. A. M. Brenninkmeijer, T. Röckmann and P. J. Fraser, Long-term tropospheric trend of octafluorocyclobutane (c-C4F8 or PFC-318), Atmos. Chem. Phys., 12(1), 261-269, doi:10.5194/acp-12-261-2012, 2012.
Prinn, R. G., R. F. Weiss, P. J. Fraser, P. G. Simmonds, D. M. Cunnold, F. N. Alyea, S. O’Doherty, P. Salameh, B. R. Miller, J. Huang, R. H. J. Wang, D. E. Hartley, C. Harth, L. P. Steele, G. Sturrock, P. M. Midgley and A. McCulloch, A history of chemically and radiatively important gases in air deduced from ALE/GAGE/AGAGE, J. Geophys. Res. – Atmos., 105(D14), 17751-17792, doi:10.1029/2000JD900141, 2000.
Prinn, R. G., R. F. Weiss, T. Arnold, J. Arduini, L. DeWitt, P. J. Fraser, A. Ganesan, C. Harth, O. Hermansen, J. Kim, P. B. Krummel, Z. M. Loh, C. R. Lunder, M. Maione, A. J. Manning, B. R. Miller, B. Mitrevski, J. Muhle, S. O’Doherty, S. Park, S. Reimann, M. Rigby, T. Saito, P. K. Salameh, R. Schmidt, P. G. Simmonds, L. P. Steele, M. K. Vollmer, R. H Wang, B. Yao, Y. Yokouchi, D. Young and L. Zhou, History of chemically and radiatively important atmospheric gases from the Advanced Global Atmospheric Gases Experiment (AGAGE), Earth System Science Data Discuss., https://doi.org/10.5194/essd-2017-134, Earth System Science Data, in press, 2018.
Redington, A. and A. Manning, InTEM inversion modelling: Australia, UK Met Office, October 2018, 18 pp., 2018.
Li, P. , J. Mühle , S. A. Montzka, D. E. Oram, B. R. Miller, R. F. Weiss , P. J. Fraser and T. Tanhua, Atmospheric histories, growth rates and solubilities in seawater and other natural waters of the potential transient tracers HCFC-22, HCFC-141b, HCFC-142b, HFC-134a, HFC-125, HFC-23, PFC-14 and PFC-116, Ocean Sci., 15, 33-60, 2019, doi.org/105194/os-15-33-2019, 2019.
Reimann, S., J. W. Elkins, P. J. Fraser, B. D. Hall, M. J. Kurylo, E. Mahieu, S. A. Montzka, R. G. Prinn, M. Rigby, P. G. Simmonds and R. F. Weiss, Observing the atmospheric evolution of ozone-depleting substances, Comptes Rendus Geoscience, doi:10.1016/j.crte.2018.08.008, 2018.
Rigby, M., J. Mühle, B. R. Miller, R. G. Prinn, P. B. Krummel, L. P. Steele, P. J. Fraser, P. K. Salameh, C. M. Harth, R. F. Weiss, B. R. Greally, S. O’Doherty, P. G. Simmonds, M. K. Vollmer, S. Reimann, J. Kim, K.-R. Kim, H. J. Wang, J. G. J. Olivier, E. J. Dlugokencky, G. S. Dutton, B. D. Hall and J. W. Elkins, History of atmospheric SF6 from 1973 to 2008, Atmos. Chem. Phys., 10(21), 10305-10320, doi:10.5194/acp-10-10305-2010, 2010.
Rigby, M., R. G. Prinn, S. O’Doherty, B. R. Miller, D. Ivy, J. Mühle, C. M. Harth, P. K. Salameh, T. Arnold, R. F. Weiss, P. B. Krummel, L. P. Steele, P. J. Fraser, D. Young and P. G. Simmonds, Recent and future trends in synthetic greenhouse gas radiative forcing, Geophys. Res. Letts., 41(7), 2623-2630, doi:10.1002/2013GL059099, 2014.
Say, D., A. J. Manning, S. O’Doherty, M. Rigby, D. Young, and A. Grant, Re-Evaluation of the UK’s HFC-134a Emissions Inventory Based on Atmospheric Observations, Environmental Science & Technology, 50: 11129-3, 2016
Simmonds, P.G., M. Rigby, A. J. Manning, M. F. Lunt, S. O’Doherty, A. McCulloch, P. J. Fraser, S. Henne, M. K. Vollmer, J. Mühle, R. F. Weiss, P. K. Salameh, D. Young, S. Reimann, A. Wenger, T. Arnold, C. M. Harth, P. B. Krummel, L. P. Steele, B. L. Dunse, B. R. Miller, C. R. Lunde, O. Hermansen, N. Schmidbauer, T. Saito, Y. Yokouchi, S. Park, S. Li, B. Yao, L. X. Zhou, J. Arduini, M. Maione, R. H. J. Wang, D. Ivy and R. G. Prinn, Global and regional emissions estimates of 1,1-difluoroethane (HFC-152a, CH3CHF2) from in situ and air archive observations, Atmos. Chem. Phys, 16, 365-382, doi:10.5194/acp-16-365-2016, 2016.
Simmonds, P. G., R. G. Derwent, A. J. Manning, A. McCulloch and S. O’Doherty, USA emissions estimates of HFC-152a, HFC-134a, HFC-143a and HFC-32 based on in situ observations at Mace Head, Atmos. Environ., 104, 27-38, doi:10.1016/j.atmosenv.2015.01.010, 2015.
Simmonds, P. G., M. Rigby, A. McCulloch, D. Young, J. Mühle, R. F. Weiss, P. K. Salameh, C.M. Harth, P. B. Krummel, P. J. Fraser, L. P. Steele, A.J. Manning, R.H.J. Wang, R. G. Prinn and S. O’Doherty, Changing trends and emissions of hydrochlorofluorocarbons and their hydrofluorocarbon replacements, Atmos. Chem. Phys., 17, 4641-4655, doi:10.519/acp-17-4641-2017, 2017.
Simmonds, P. G., M. Rigby, A. McCulloch, M. K. Vollmer, S. Henne, J. Mühle, B. R. Miller,S. O’Doherty, A.J. Manning, P. B. Krummel, P. J. Fraser, D. Young, R. F. Weiss, P. K. Salameh, C.M. Harth, S. Reimann, C. M. Trudinger, L. P. Steele, R.H.J. Wang, D. Ivy, R. G. Prinn, B. Mitrevski and D. M. Etheridge, Recent increases in the growth rate and emissions of HFC-23 (CHF3) and the link to HCFC-22 (CHClF2) production, Atmos. Chem. Phys., 18, 4153–4169, 2018, https://doi.org/10.5194/acp-18-4153-2018, 2018.
Stanley, K. M., D. Say, J. Mühle, C. M. Harth, P. B. Krummel, D. Young, S. J. O’Doherty, P. K. Salameh, P. G. Simmonds, R. F. Weiss, R. G. Prinn, P. J. Fraser, and M. Rigby. 2020. ‘Increase in global emissions of HFC-23 despite near-total expected reductions’, Nature Communications, 11: 397.
Stohl, A., P. Seibert, J. Arduini, S. Eckhardt, P. Fraser, B. Greally, C. Lunder, M. Miaone, J. Mühle, S. O’Doherty, R. Prinn S. Reimann, T. Saito, N. Schmidbauer, P. Simmonds, M. Vollmer, R. Weiss and Y. Yokouchi, An analytical inversion method for determining regional and global emissions of greenhouse gases: sensitivity studies and application to halocarbons, Atmos. Chem. Phys., 9(5), 1597-1620, doi:10.5194/acp-9-1597-2009, 2009.
Sturges, W. T., D. E. Oram, J. C. Laube, C. E. Reeves, M. J. Newland, C. Hogan, P. Martinerie, E. Witrant, C. A. M. Brenninkmeijer, T. J. Schuck and P. J. Fraser, Emissions halted of the potent greenhouse gas CF3SF5, Atmos. Chem. Phys., 12(8), 3653-3658, doi:10.5194/acp-12-3653-2012, 2012.
Trudinger, C. M., P. J. Fraser, D. M. Etheridge, W. T. Sturges, , M. K. Vollmer, M. Rigby, P. Martinerie, J. Mühle, D. R. Whorton, P. B. Krummel, L. P. Steele, B. R. Miller, J. Laube, F. S. Mani, P. J. Rayner, C. M. Harth, E. Witrant, T. Blunier, J. Schwander, S. O’Doherty and M. Battle, Atmospheric abundance and global emissions of perfluorocarbons CF4, C2F6 and C3F8 since 1800 inferred from ice core, firn, air archive and in situ measurements, Atmos. Chem. Phys., 16, 11733-11754, doi:10.5194/acp-16-11733-2016, 2016.
Velders, G. J. M., S. O. Anderson J. S. Daniel, D. W. Fahey and M. McFarland, The importance of the Montreal Protocol in protecting climate, Proc. Natl. Acad. Sci., 104(12), 4814-4819, doi:10.1073/pnas.0610328104, 2007.
Velders, G. J. M., D. W. Fahey, J. S. Daniel, M. McFarland and S. O. Anderson, The large contribution of projected HFC emissions to future climate forcing, Proc. Natl. Acad. Sci., 106, 10949-10954, doi:10.1073/pnas.0902817106, 2009
Velders, G. J. M., A. R. Ravishankara, M. K. Miller, M. J. Molina, J. Alcamo, J. S. Daniel, D. W. Fahey, S. A. Montzka and S. Reimann, Preserving Montreal Protocol climate benefits by limiting HFCs, Science, 335(6071), 922–923, doi:10.1126/science.1216414, 2012.
Velders, G. J. M., S. Solomon and J. S. Daniel, Growth of climate change commitments from HFC banks and emissions, Atmos. Chem. Phys., 14 (9), 4563-4572, doi:10.5194/acp-14-4563-2014, 2014.
Velders, G. J. M., D. W. Fahey, J. S. Daniel, S. O. Anderson amd M. McFarland, Future atmospheric abundances and climate forcings from scenarios of global and regional hydrofluorocarbon (HFC) emissions, Atmos. Environ., 123, 200-209, doi:10.1016/j.atmosenv.2015.10.071, 2015.
Vollmer, M. K., B. R. Miller, M. Rigby, S. Reimann, J. Mühle, P. B. Krummel, S. O’Doherty, J. Kim, T.-S. Rhee, R. F. Weiss, P. J. Fraser, P. G. Simmonds, P.K. Salameh, C. M. Harth, R. H. J. Wang, L. P. Steele, D. Young, C. R. Lunder, O. Hermansen, D. Ivy, T. Arnold, N. Schmidbauer, K.-R. Kim, B. R. Greally, M. Hill, M. Leist, A. Wenger and R. G. Prinn, Atmospheric histories and global emissions of the anthropogenic hydrofluorocarbons (HFCs) HFC-365mfc, HFC-245fa, HFC-227ea and HFC-236fa, J. Geophys. Res. – Atmos., 116, D08304, doi:10.1029/2010JD015309, 2011.
Vollmer, M., S. Reimann, M. Hill and D. Brunner, First observations of the fourth generation synthetic halocarbons HFC-1234yf, HFC-1234ze(E) and HCFC-1233zd(E) in the atmosphere, Environ. Sci. Technol., 49, 2703-2708, doi:10.1021/es505123x, 2015.
Weiss, R. F., J. Mühle, P. K. Salameh and C. M. Harth, Nitrogen trifluoride in the global atmosphere, Geophys. Res. Lett., 35, L20821, doi:10.1029/2008GL035913, 2008.
Wong, D., P. Fraser, P. Lavoie and J. Kim, PFC emissions from detected versus nondetected anode effects in the aluminum industry, JOM, 67(2), 342-353, doi:10.1007/s11837-014-1265-8, 2015.
Xiang, B., P. Patra, S. Montzka, S. Miller, J. Elkins, F. Moore, E. Atlas, B. Miller, R. Weiss, R. Prinn and S. Wofsy, Global emissions of refrigerants HCFC-22 and HFC-134a: unforeseen seasonal contributions, Proc. Natl. Acad. Sci., 111(49), 17,379-17,384, doi:10.1073/pnas.1417372111, 2014.
Xu, Y., D. Zaelke, G. J. M. Velders and V. Ramanathan, The role of HFCs in mitigating 21st century climate change, Atmos. Chem. Phys., 13 (12), 6083-6089, doi:10.5194/acp-13-6083-2013, 2013.
.
![]()
ROSS KIEINSCHMIT – RADIOACTIVE WATER – QUEENSLAND
![]()
![]()
Swifts occur on all the continents except Antarctica,
The Swift